Graphics Reference
In-Depth Information
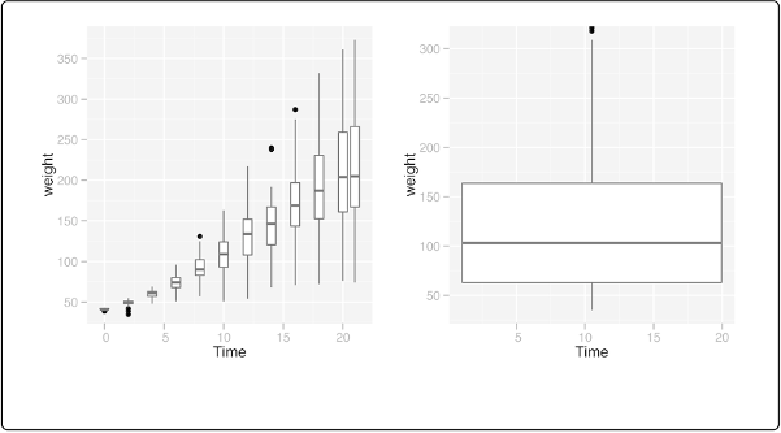
Figure 5-17. Left: grouping into box plots; right: what happens if you don't specify groups
See Also
Instead of binning the data, it may be useful to display a 2D density estimate. To do this, see
Adding Fitted Regression Model Lines
Problem
You want to add lines from a fitted regression model to a scatter plot.
Solution
To add a linear regression line to a scatter plot, add
stat_smooth()
and tell it to use
meth-
od=lm
. This instructs it to it the data with the
lm()
(linear model) function. First we'll save the
base plot object in
sp
, then we'll add different components to it:
library(gcookbook)
# For the data set
# The base plot
sp
<-
ggplot(heightweight, aes(x
=
ageYear, y
=
heightIn))
sp
+
geom_point()
+
stat_smooth(method
=
lm)