Graphics Reference
In-Depth Information
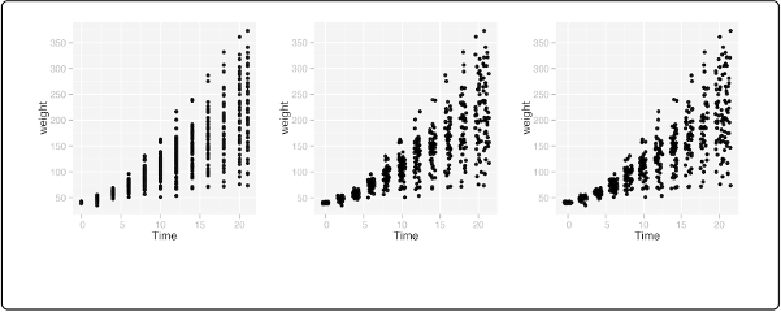
Figure 5-16. Left: data with a discrete x variable; middle: jittered; right: jittered horizontally only
When the data has one discrete axis and one continuous axis, it might make sense to use box
plots, as shown in
Figure 5-17
. This will convey a different story than a standard scatter plot be-
cause it will obscure the numberof data points at each location on the discrete axis. This may be
problematic in some cases, but desirable in others.
With the
ChickWeights
data, the x-axis is conceptually discrete, but since it is stored numer-
ically,
ggplot()
doesn't know how to group the data for each box. If you don't tell it how to
group the data, you get a result like the graph on the right in
Figure 5-17
. To tell it how to group
the data, use
aes(group=...)
. In this case, we'll group by each distinct value of
Time
:
sp1
+
geom_boxplot(aes(group
=
Time))