Graphics Reference
In-Depth Information
the
low
and
high
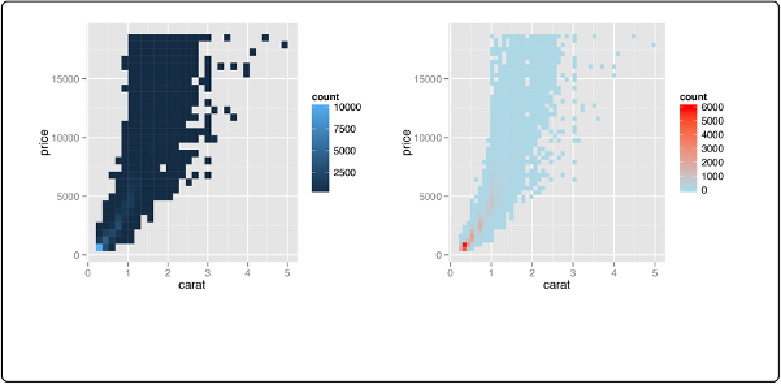
colors. By default, the legend doesn't show an entry for the lowest values. This
is because the range of the color scale starts not from zero, but from the smallest nonzero quant-
ity in a bin—probably 1, in this case. To make the legend show a zero (as in
Figure 5-14
,
right),
sp
+
stat_bin2d()
sp
+
stat_bin2d(bins
=
50
)
+
scale_fill_gradient(low
=
"lightblue"
, high
=
"red"
, limits
=
c(
0
,
6000
))
Figure 5-14. Left: binning data with stat_bin2d(); right: with more bins, manually specified colors,
and legend breaks
Another alternative is to bin the data into hexagons instead of rectangles, with
stat_binhex()
(
Figure 5-15
)
. It works just like
stat_bin2d()
. To use it, you must first install the hexbin pack-
age, with
install.packages("hexbin")
:
library(hexbin)
sp
+
stat_binhex()
+
scale_fill_gradient(low
=
"lightblue"
, high
=
"red"
,
limits
=
c(
0
,
8000
))
sp
+
stat_binhex()
+
scale_fill_gradient(low
=
"lightblue"
, high
=
"red"
,
breaks
=
c(
0
,
250
,
500
,
1000
,
2000
,
4000
,
6000
),
limits
=
c(
0
,
6000
))