Graphics Reference
In-Depth Information
# Make a copy of the data
hw
<-
heightweight
# Categorize into <100 and >=100 groups
hw$weightGroup
<-
cut(hw$weightLb, breaks
=
c(
-
Inf,
100
, Inf),
labels
=
c(
"< 100"
,
">= 100"
))
# Use shapes with fill and color, and use colors that are empty (NA) and
# filled
ggplot(hw, aes(x
=
ageYear, y
=
heightIn, shape
=
sex, fill
=
weightGroup))
+
geom_point(size
=
2.5
)
+
scale_shape_manual(values
=
c(
21
,
24
))
+
scale_fill_manual(values
=
c(
NNA
,
"black"
),
guide
=
guide_legend(override.aes
=
list(shape
=
21
)))
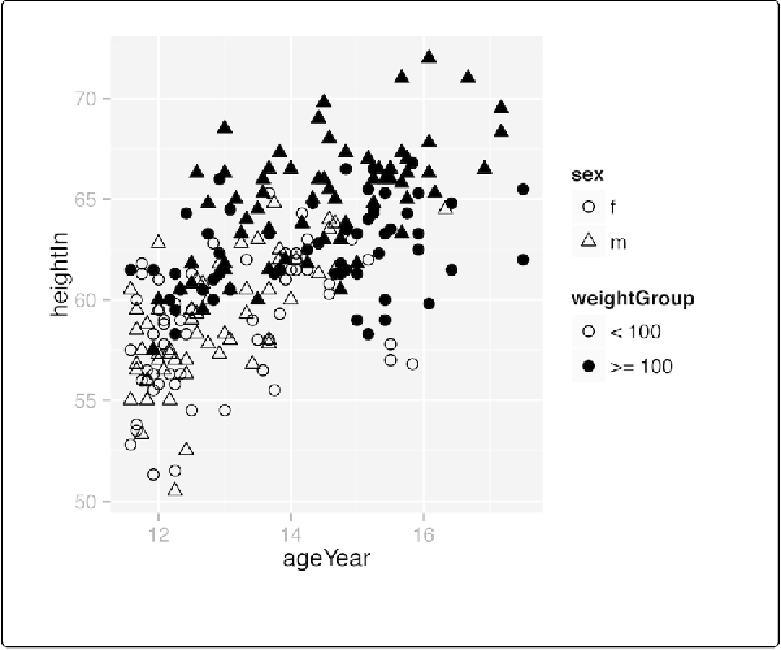
Figure 5-8. A variable mapped to shape and another mapped to fill