Graphics Reference
In-Depth Information
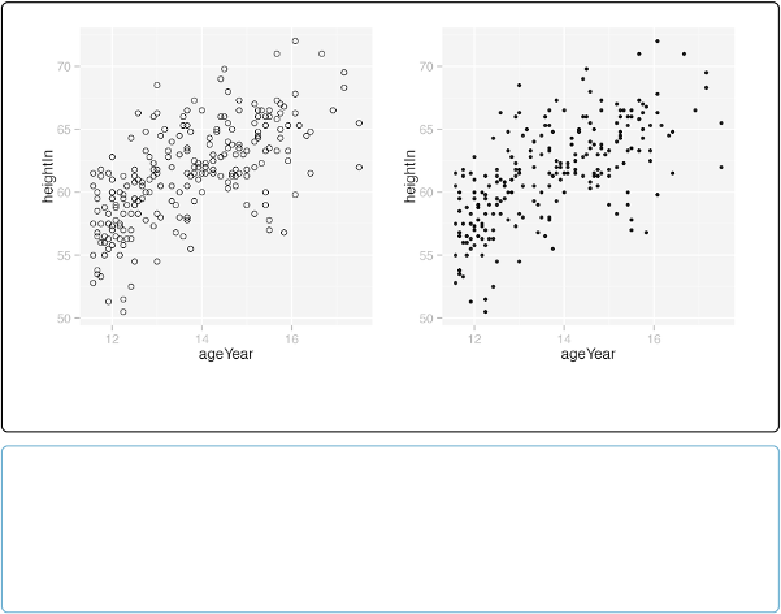
The size of the points can be controlled with
size
. The default value of
size
is 2. The following
ggplot(heightweight, aes(x
=
ageYear, y
=
heightIn))
+
geom_point(size
=
1.5
)
Figure 5-2. Left: scatter plot with hollow circles (shape 21); right: with smaller points
NOTE
When displaying to screen or outputting to bitmap files like PNG, the default solid circle shape (#16)
can result in aliased (jagged-looking) edges on some platforms. An alternative is to use shape 19, which
is also a solid circle, but comes out smooth in more cases (see
Figure 5-3
). See
Outputting to Bitmap
(PNG/TIFF) Files
for more about anti-aliased output.