Graphics Reference
In-Depth Information
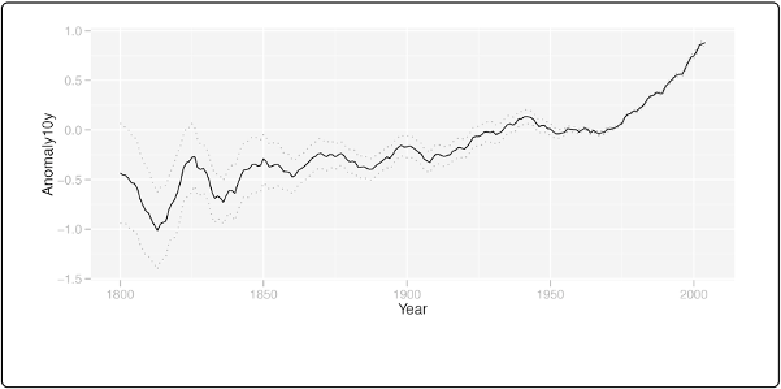
Figure 4-26. A line graph with dotted lines representing a confidence region
Shaded regions can represent things other than confidence regions, such as the difference
between two values, for example.
In the area graphs in
Making a Stacked Area Graph
, the yrange of the shaded area goes from
0
to
y
. Here, it goes from
ymin
to
ymax
.