Graphics Programs Reference
In-Depth Information
with 0 representing pure black (Zone 0) and 255 representing pure white
(Zone X), the histogram maps out how many of the pixels within an image
have each level of brightness (or luminosity) from black (0) to white (255).
The portion of the histogram that is to the left of the chart shows the shadow
information, or how much of your image is dark to black, while the part to the
right shows the highlight information or the amount of the image that is light
to white. The vertical height of the graph indicates the relative number of
pixels that equate to each brightness level between white and black. Because
each and every image is dif erent, histograms are inherently unique for every
image. The histogram provides invaluable information to the photographer
in its mapping of tonal values within an image, which ef ectively monitors the
dynamic range or range of input possible at the point of capture. Immediately,
one can see where shadow and highlight information begins and what sort
of tonal range exists. This allows the photographer to make re-exposure
decisions accordingly. Although this may not make sense yet, after we
introduce a few more concepts we can look at examples visually so that you
can get more comfortable with this tool.
There are two places we will be looking at histograms throughout this text.
First, we will use the histogram in-camera to evaluate exposure in the i eld
and, second, we will also use the histograms in Photoshop to evaluate the
image data as we process images in the digital darkroom. Although the
camera histogram and the software histogram are not found in the same
place, how they function and what they tell us is actually exactly the same.
For demonstration purposes I am using the software histograms as seen with
the Photoshop CS4 histogram palette instead of the camera histogram, as the
software histograms are easier to see and they convey the same information
as we would see if we were viewing them on the camera at the time of
capture.
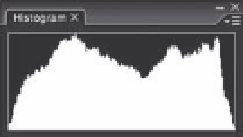
A software histogram
The relationship between the Zone system values and RGB and Grayscale
tonality is illustrated below.
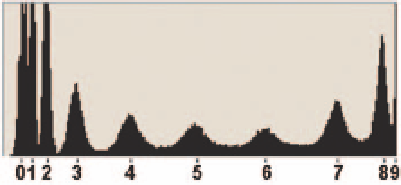
Zone System Histogram
Black
White
Zones
The diagram above indicates black to white with Zone 0 = RGB 0, Zone I = RGB
25, Zone II = RGB 51, Zone III = RGB 76, Zone IV = RGB 102, Zone V = RGB 128,
Zone VI = RGB 153, Zone VII = RGB 229, and Zone X = 255.

Search WWH ::

Custom Search