Information Technology Reference
In-Depth Information
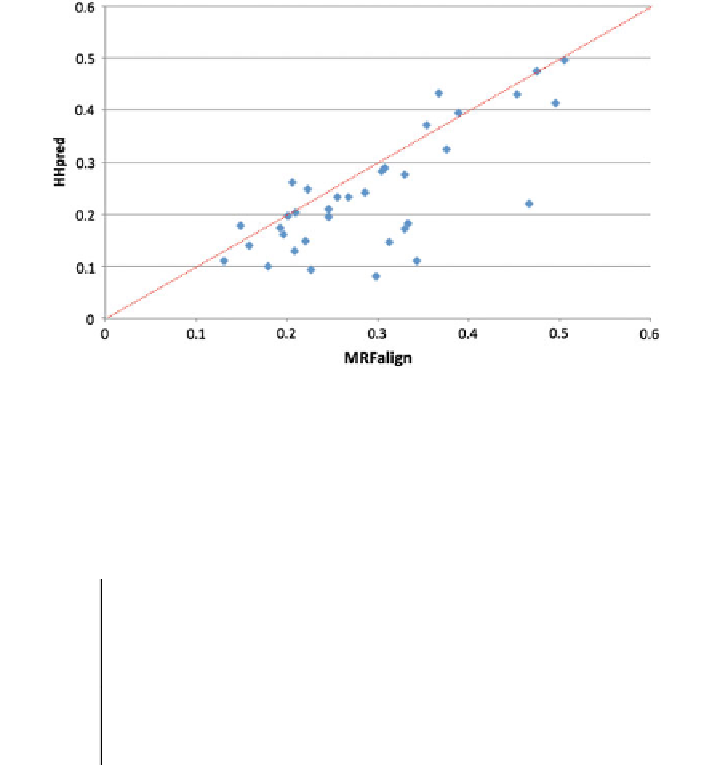
Fig. 4.2 The model quality, measured by TM-score, of our method and HHpred for the 36
CASP10 hard targets. Each point represents two models generated by our method (X-axis) and
HHpred (Y-axis), respectively. TM-score ranges from 0 to 1 with 0 indicating the worst quality
and 1 the highest
Table 4.17 Fold recognition rate of MRFalign on SCOP40, with respect
to the similarity
(measured by E-value) between the training and test data
E<1e
35
1e
35<E<1e
2
E > 1e
2
−
−
−
−
Top1
Top5
Top10
Top1
Top5
Top10
Top1
Top5
Top10
Hmmscan
5.0
5.6
5.6
7.3
7.9
7.9
6.4
7.3
7.4
FFAS
10.3
14.5
15.8
9.7
12.9
13.5
11.6
16.5
17.5
HHsearch
16.0
23.2
26.5
18.5
26.2
30.3
18.9
27.2
31.7
HHblits
16.9
23.1
25.5
20.8
27.4
28.9
20.2
28.3
31.1
MRFalign
25.5
35.9
39.4
29.7
39.5
43.3
29.4
39.0
43.6
The numbers are presented as percentage
References
1. Murzin, A.G.: SCOP: a structural classi
cation of proteins database for the investigation of
sequences and structures. J. Mol. Biol. 247(4), 536
-
540 (2013)
2. Andreeva, A.: SCOP database in 2004: re
nements integrate structure and sequence family
data. Nucleic Acids Res. 32(l), 226
-
229 (2004)
3. Andreeva, A.: Data growth and its impact on the SCOP database: new developments. Nucleic
Acids Res. 36(1), D419
-
D425 (2008)
4. Angerm
ding, J.: Discriminative modelling of context-specific amino
acid substitution probabilities. Bioinformatics 282(4), 3240
ü
ller, C., Biegert, A., S
ö
3247 (2012)
5. Eddy, S.R.: HMMER: Profile Hidden Markov Models for Biological Sequence Analysis
(2001)
-


Search WWH ::

Custom Search