Information Technology Reference
In-Depth Information
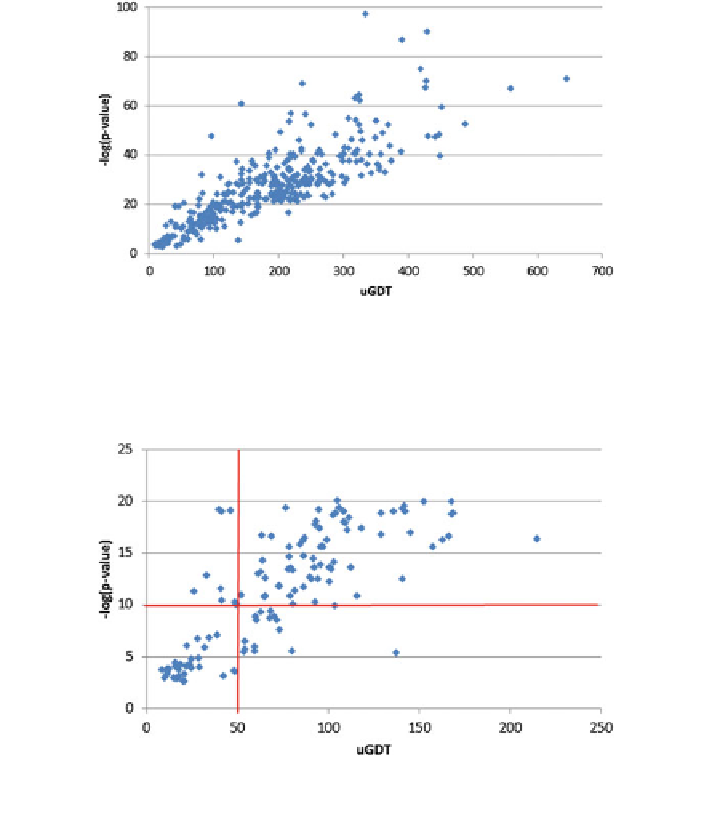
Fig. 3.2 The relationship between P-value and the alignment quality of the first-ranked homologs
on the 368 CAMEO targets. The x-axis is the alignment quality measured by uGDT and the y-axis
is
log(P-value)
−
Fig. 3.3 The relationship between P-value and the alignment quality of the first-ranked homologs
on the 132 CAMEO targets with
log(P-value) < 20. The x-axis is the alignment quality measured
−
by uGDT and the y-axis is
log(P-value)
−
3.6 Interpreting a Pairwise Alignment
The last section in the ranking
file contains the alignments of the query protein to the
top-ranked subject proteins. Figure
3.4
shows an example alignment between the
query and subject protein. The alignment consists of one or more blocks with the
following lines: the
first line
'
T T0644
'
is the subject protein name and the third line
'
is the query protein name, each followed by its sequence. The line in the
middle shows the alignment score at each aligned positions. The higher the score, the
better the alignment is. The symbols used here have the following meanings.
S T0645
'
Search WWH ::

Custom Search