Database Reference
In-Depth Information
32.
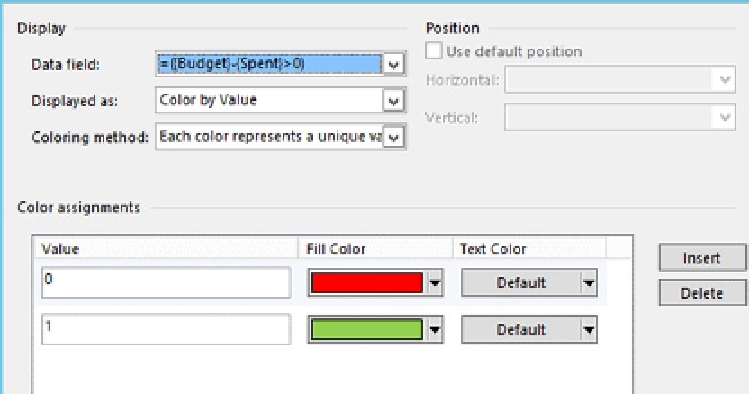
Choose Displayed as value to be 'Color by Value.'
33.
Choose Coloring method value to be 'Each color represents a
unique value.'
34.
For values 0, 1 set fill colors, as shown in Figure
A-22
.
Figure A-22.
Choosing data graphic options
35.
Create another new item and select custom formula field as in
the previous step. Set the formula:
={Budget}-{Spent}
36.
Use Icon Set as Displayed as the value and choose flags Style.
37.
Set values less than 0 to show a red flag and values greater
than or equal to 0 as green, and click OK.
38.
Create another New item, and choose the Profile column as
the Data field.