Agriculture Reference
In-Depth Information
1,200
Production
Consumption
1,000
800
600
400
200
0
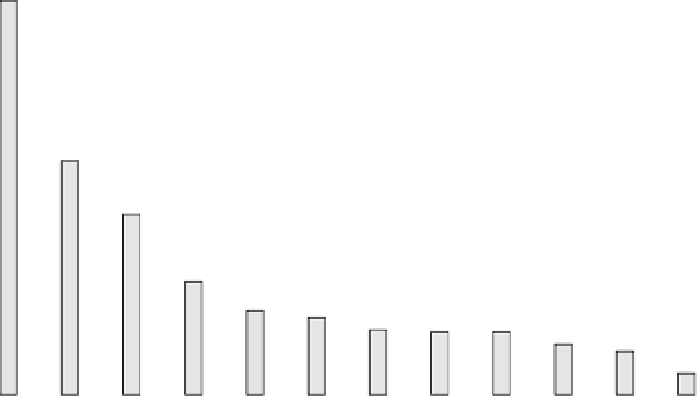
Figure 26.2.
Production and consumption of olive oil in leading countries between 2003-2004 and 2008-2009
(source: Adapted from IOC, 2010a).
600
Production
Consumption
500
400
300
200
100
0
Figure 26.3.
Production and consumption of table olive in leading countries between 2003-2004 and
2008-2009 (source: Adapted from IOC, 2010a).


Search WWH ::

Custom Search