Agriculture Reference
In-Depth Information
Table 21.2.
Leading exporters and importers of single-strength orange juice and orange juice
concentrate by quantity (metric tons).
Orange Juice, Single Strength
Orange Juice Concentrate
Exporters
2009
Importers
2009
Exporters
2009
Importers
2009
Brazil
1,494,400
Belgium
914,010
Brazil
574,788
USA
285,364
Belgium
809,108
France
610,396
Spain
75,856
United Kingdom
232,884
Netherlands
563,550
Netherlands
603,108
USA
69,692
Canada
43,282
Germany
380,625
Germany
420,470
Costa Rica
48,502
France
37,800
USA
309,287
USA
310,377
Cuba
25,000
Ireland
35,452
Spain
171,597
Canada
245,775
Belize
20,428
Republic of Korea
23,795
Switzerland
85,946
United Kingdom
239,893
Israel
12,725
Spain
15,713
Mexico
83,179
Japan
89,212
Canada
12,316
Hungary
13,852
France
64,083
Sweden
67,964
Thailand
9,611
Israel
11,446
Saudi Arabia
63,063
Spain
67,614
China
8,892
Oman
10,626
United Arab
60,074
China
49,979
United Arab
8,485
Pakistan
9,775
Emirates
Emirates
Denmark
45,206
Russian
47,566
Argentina
7,693
Nicaragua
9,081
Federation
Source: FAO (2011).
consumption per decade increased from 28.5 liters in the
1980s to 32.3 liters in the 1990s and decreased to 30.4 liters
in the 2000s. Orange juice represented 62.2%, 60.5%, and
56.8% of the total juice consumed in the US in those
decades, respectively, indicating that although it is still
the most consumed fruit juice, both the total amount of
juice consumed and its share of the fruit juice market have
recently decreased (Pollack and Perez, 2008). The average
orange consumption for the 2001-2008 period in the United
States decreased by 11% with respect to the 1990s. Such
decrease is the combined result of other fruit juice and bev-
erage competition, increased orange juice price, and other
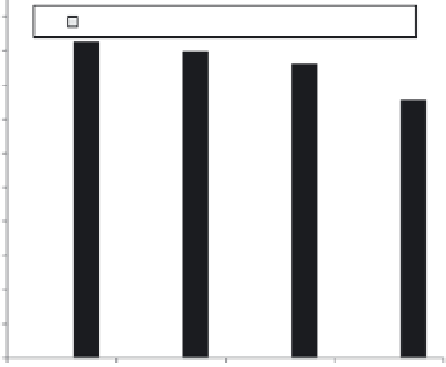
market trends. Figure 21.2 shows the US average consump-
tion of fresh and processed oranges per capita for the last
three decades.
The overall decrease in consumption of oranges and
orange juice in the 2000s can be attributed in part to a
decrease in production that resulted from losses due to the
2004 hurricanes, the spread of citrus canker (also driven
by the strong winds and rain from the hurricanes), the now
defunct canker eradication program that forced growers to
remove all citrus trees within a 580 m (1900 ft) diameter
circle around infected trees, and the emergence of huan-
glongbing disease, a bacterial disease that obstructs the
phloem, resulting in small, misshapen fruit and eventually
tree death. Details of these and other citrus diseases can
be found elsewhere (Timmer et al., 2000). As a result, the
bearing orange grove area decreased from about 330,000 ha
in 2000 to 257,000 ha in 2009. Lower supply caused orange
juice prices to rise and a decrease in demand followed.
In addition to the specifics of the orange market, overall
fruit juice consumption decreased perhaps
as a result of
100
Fresh
Processed
To t a l
90
80
70
60
50
40
30
20
10
0
1971-80
1981-90
1991-00
2001-09
Figure 21.2.
Average per capita consumption of
oranges in the United States, for selected years
(source: Adapted from USDA-ERS, 2011).


Search WWH ::

Custom Search