Agriculture Reference
In-Depth Information
usually mean smallholder production with nonintensive
farming systems. Often on a multicropping system rather
than in monoculture, the stakeholders are producing vari-
ous cultivars, including neglected ones in small backyards
(Quintero and Garcia, 2008). These edible Musa plants pro-
duced for local markets belong to various genomic groups.
The cooking bananas include some plantains (AAB), the
'Bluggoe' and 'Pisang Awak' (ABB), the 'Lujugira' high-
land bananas (AAA), and the other AAB cooking vari-
eties. Minor dessert banana groups include 'Sucrier' and
'Lakatan' (AA), 'Figue Rose' and 'Ibota' (AAA), and
'Figue Pomme' and 'Mysore' (AAB). No comparison can
be made with intensive industrial single-cropping planta-
tions targeting the export sector, where the Cavendish sub-
group ('Grande Naine,' 'Williams' and 'Poyo' cultivars
AAA) is the major land race on trade market, with 97%
of the total after the disappearance of the subgroup 'Gros
Michel' in the 1960s (Lassoudiere, 2010).
Among a genomic subgroup, a small genetic diversity
could be observed (Lescot, 2010). However, a large pheno-
typic diversity can be highlighted mainly due to mutations
and to human selection during decades. For instance, the
Cavendish, the highland banana, and the plantain subgroups
exhibit a large phenotypic diversity with about 20, 50, and
more than 150 cultivars, respectively.
The banana is a climacteric fruit. After a development
phase during which the fruit increases in size and accu-
mulates starch, the fruit growth ceases when being fully
mature, and the ripening process is initiated by a quick rise
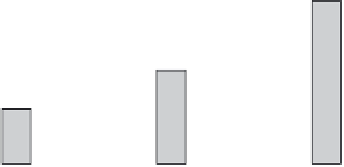
Africa
World
Asia
Americas
100
80
60
40
20
0
1990
2000
2010
Figure 8.1.
World and regional banana production
for selected years (source: Adapted from FAO, 2011).
importance as it forms a considerable portion of the annual
income for the stakeholders (Zhang et al., 2005).
The US per capita annual banana consumption (Fig. 8.2)
peaked at about 31 lbs in 1999 from about 21 lbs in 1980.
However, during the last decade, the per capita consumption
has decreased and remained between 24 and 26 lbs/year.
PRODUCTION, VARIETIES,
AND HARVESTING
About 1,200 varieties of bananas are known and classi-
fied around the world. The traditional agricultural systems
Table 8.1.
Leading banana producer, exporter, and importer countries (million metric tons).
Producers
1
2009
2
2009
2
1990
2000
2010
Exporters
Importers
India
7.15
14.14
31.90
Ecuador
5.70
USA
3.58
China
1.66
5.14
9.85
Colombia
1.97
Germany
1.36
Philippines
3.54
4.93
9.10
Philippines
1.74
Belgium
1.32
Ecuador
3.05
6.48
7.93
Costa Rica
1.72
Japan
1.11
Brazil
5.73
5.66
6.98
Guatemala
1.48
Russian Federation
0.98
Indonesia
2.41
3.75
5.81
Belgium
1.24
United Kingdom
0.94
Tanzania
0.16
0.70
2.92
USA
0.54
Italy
0.68
Guatemala
0.45
0.96
2.62
Honduras
0.52
France
0.53
Mexico
1.99
1.86
2.10
Germany
0.39
China
0.49
Colombia
1.24
1.59
2.03
Dominican Republic
0.28
Canada
0.48
Costa Rica
1.74
2.18
1.80
Panama
0.26
Argentina
0.34
Thailand
1.61
2.03
1.58
Cote d'Ivoire
0.26
Republic of Korea
0.26
1
Countries ranked by 2010 production figures.
2
Latest data available.
Source: Adapted from FAO (2011).


Search WWH ::

Custom Search