Game Development Reference
In-Depth Information
The final piece of the ET-API foundation is the transmission and reception of messages over the network between
the browser application and the game engine. ET-API could have used HTTP, but browsers now support a much more
efficient network protocol, WebSocket. WebSocket is a communication protocol that allows for bidirectional text and
binary message passing. Think TCP for the browser. The WebSocket protocol is very bandwidth efficient (message
framing is at most 14 bytes), and the payloads are custom to the application. Since a WebSocket connection is only a
thin layer on top of TCP, the latency is low, too.
Examples
With the ET-API foundation in place, I will introduce tools that were created with ET-API. This section will cover
sample applications that include asset preview, live monitoring, live editing, remote viewing, and unit testing.
My engine allows for browser tools to preview three asset classes: textures, meshes, and models. Models are a
combination of textures, meshes, and shaders. I have not considered audio preview.
The way the tools preview each type of asset is essentially the same. The tool sends a command requesting
a specific asset, and the engine sends the asset over as a result. Once the tool receives the asset data, it caches
the data locally so the network traffic is minimal. How the asset data is packed depends on the asset class. For a
mesh, the index buffer and associated vertex buffers must be sent over. This mesh data is then loaded into WebGL
index and vertex buffer objects. For a texture, each slice of the mipmap pyramid must be sent over. Once the entire
mipmap pyramid is in the browser, the preview tool can display the texture at each level of detail and overlay texture
coordinates on top using the browser canvas.
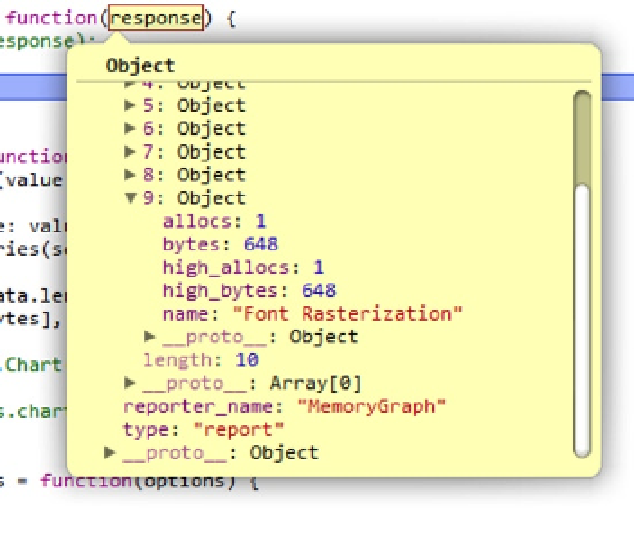
Live performance monitoring tools are fed data by a reporter. The browser tool subscribes to a reporter and sets
an update frequency. Figure
10-2
shows a report from the
MemoryGraph
reporter.
Figure 10-2.
A sample message from the MemoryGraph reporter
Each
MemoryGraph
report includes an array of allocators. For each allocator, the current number of allocations
and bytes allocated is included along with the high water mark of each. Figure
10-3
displays this data with a live graph.