Geoscience Reference
In-Depth Information
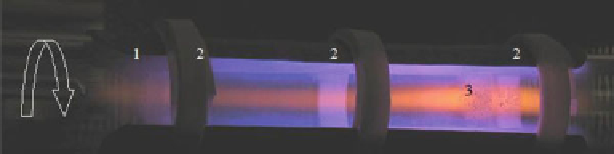
Fig. 6.11
Pressure ports (
2
) in the quartz tube (
1
) to measure pressure distribution inside longitudi-
nal plasmoid created by capacity-coupled high-frequency discharge.
V
t
140 m/s;
P
HF
D
1.7 kW;
P
st
D
40 Torr;
1
quartz tube,
2
pressure sensor ports,
3
longitudinal plasmoid
BL motion near airplanes it has a very small drag. Note that BL long motion near
airplanes represents a problem from the energy conservation point of view. So,
studies of longitudinal vortex plasmoid aerodynamics can be helpful in clarification
of the unusual aerodynamic properties of the real BL.
It is important to obtain a reliable information about a pressure distribution
inside the longitudinal vortex plasmoid. The important task of the vortex control
by a capacity-coupled high-frequency discharge can be studied in this experiment.
However, correct measurements of a pressure distribution by the Pitot tube in
two-dimensional (2D) swirl flow are a difficult technical task (for discussion, see
(Klimov
2009
; Bityurin et al.
2010
)). A typical static pressure distribution in the
vortex longitudinal vortex plasmoid measured by the pressure sensors is shown in
Figs.
6.11
,
6.12
,and
6.13
. One can see that the static pressure was increased up to
50% when the plasma was switched on. Therefore, there is the vortex attenuation
and its dissipation by a capacity-coupled high-frequency discharge.
Some additional experiments were carried out to prove the vortex attenuation by
capacity-coupled high-frequency discharge. A small helium jet was injected through
a thin dielectric tube into the vortex region. This jet was deflected by the swirl flow at
the plasma-off point. It was revealed that the helium jet marker was not deflected by
the swirl flow at the high-frequency plasma-on point. The swirl flow is very weak
to deflect the helium jet in this regime at plasma-on. Thus, there is a real vortex
attenuation by the high-frequency plasma-on. This conclusion correlates with one
obtained by pressure distribution analysis.
6.8
Measurements of a Power Balance in the Vortex
Longitudinal Plasmoid
The experimental setup used to study the power budget in the longitudinal plas-
moid vortex is shown in Fig.
6.1
, Klimov (
2004
). The scheme of calorimetric
measurements in this experimental setup is shown in Fig.
6.14
. Thermocouples are
arranged in a quartz tube behind the plasma formation. The optical pyrometer is