Geoscience Reference
In-Depth Information
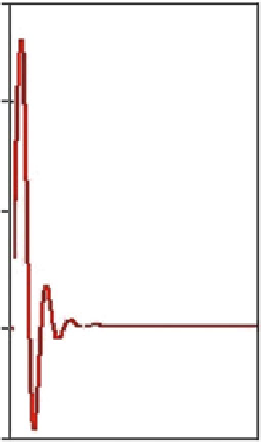
Fig. 5.19
Field
H
at altitude
1 km at distance of 1 km from
the lightning channel
15
10
5
0
−
5
0
10
t, ms
300
200
29000
31000
100
40000
50000
60000
80000
0
−
20
0
2
4
6
8
10
t, ms
Fig. 5.20
Time dependence of electric field above the cloud for various values of altitude.
Numbers on curves
, altitude in meters
radius of 100 km during a time about of 1 ms. In Fig.
5.21
are shown spatial
distributions of the electric field at the bottom border of the ionosphere after 1 ms
(Fig.
5.21
a) and 10 ms (Fig.
5.21
b) from the moment of the beginning of the
lightning discharge.