Geoscience Reference
In-Depth Information
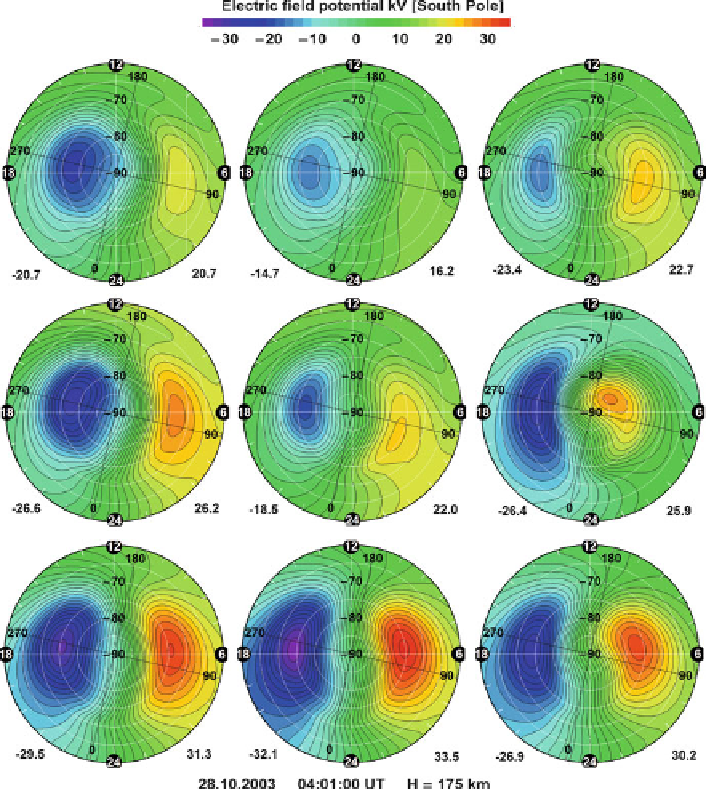
Fig. 4.6
Electric potential distributions for various IMF orientations as in Fig.
4.3
obtained from
UAM simulations using the input FAC patterns as shown in Fig.
4.5
. The potential pattern
shows the characteristic two-cell structure with stronger anti-sunward convection over the pole
for southward IMF and a clear IMF B
y
dependence similar to the statistical observational pattern
shown in Fig.
4.3
. In contrast to the observations, the four-cell pattern for northward IMF (Sector
0inFig.
4.3
) is not obtained
in Fig.
4.6
. They reproduce mostly the average climatological pattern as obtained,
for example, with the Cluster/EDI observations (see Fig.
4.3
) in dependence of
IMF strength and orientation, except the four-cell pattern for purely northward IMF
(sector 0).
In the following, specified values of time-varying input parameters have to be
used for the modeling of concrete case study situations.