Graphics Programs Reference
In-Depth Information
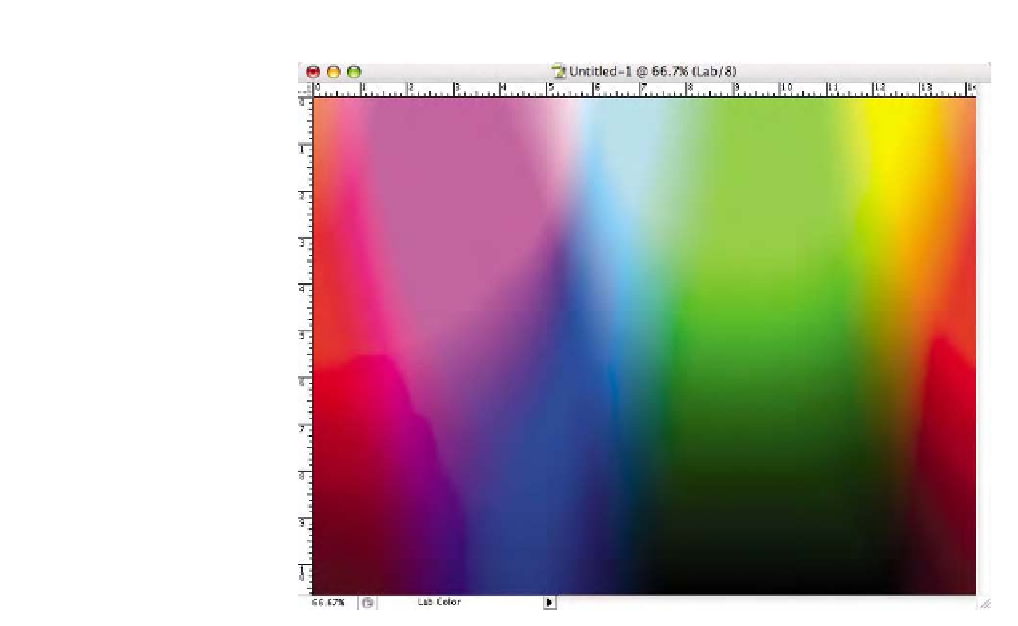
Fig. 9-12-19
The finished
Granger Rainbow should
look like this.
colors might band in transmissions from the most saturated colors we can
produce within the working space it was built. The Granger Rainbow is
similar, but also shows the fully saturated colors gradating in tonal
density. In all cases, we are hoping to see how a profile affects the gra-
dients, which in a perfect world always remain smooth after applying a
profile. To see these synthetic images in action, see the tutorial on eval-
uating your output profiles.
Since the Granger Rainbow image is in LAB, you can convert this file
to any working space you wish. Referring back to Tutorial #4, you may
want to use this test image in addition to
WorkingSpaceTestFile.tif
to
see the effects of different working spaces using a single output profile.
Output profiles are built without specific information about the image
source or working space, therefore some assumptions need to be made
when they are built. Using this Granger Rainbow in sRGB and Adobe
RGB (1998) will allow you to further see the effect of two working spaces
using a single output profile. Depending on the gamut of the image, a
smaller working space might produce preferable results.
Tutorial #13: Evaluating Your Output Profiles
This tutorial is intended to give you an idea of the quality of the output
profiles you build. There are two basic techniques using different imagery