Graphics Programs Reference
In-Depth Information
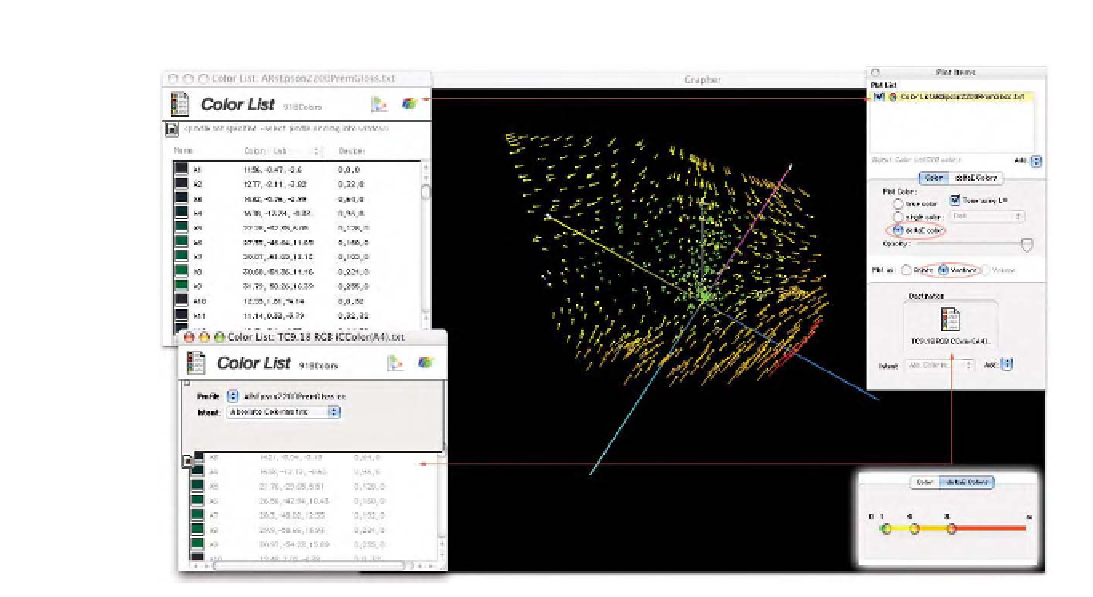
Fig. 8-13
This shows how ColorThink can plot a 3D deltaE map of the measured data of a profile versus the reference data. The top color
list is generated after opening the original reference data, in this case the TC9.18 target for an iCColor Spectrophotometer. Added to this
list was the actual profile generated, which are the device colors seen to the right of the reference colors specified in LAB. The second color
list below is the measured data from the targets read with the iCColor. When the Vector radio button is selected and the Plot colors are
set for deltaE, ColorThink calculates this 3D map. Notice to the lower right that I've shown the deltaE color selector.
data into this color list. This color list updates and shows the LAB and
device colors as seen in Fig. 8-13. The next step is to create a second color
list by opening the measured data file saved from the profiling process,
which again is just a text file. Most other packages will provide a LAB
text file. In the case of ProfileMaker Pro, the spectral data needs to be
converted to LAB and the MeasureTool can do this and save out a text
file to open.
With the two color lists, all we have to do is make the first color list
active and click on the 3D icon in the window. This plots the 3D gamut
of this list. To show the deltaE between the expected and measured data,
simply select the second color list (measured data) from the
Destination
pop-up menu, then click the
Vector
radio button, and then click on the
deltaE
color radio button. This produces the appearance seen in Fig. 8-
13, which can be rotated and fully examined. ColorThink plots the deltaE
in color, based on the location of the three colored sliders seen in the
deltaE Colors setup. We can move the three sliders to show visually the
range of deltaE, in this case from a value of 1 to over 8. The colors in