Graphics Programs Reference
In-Depth Information
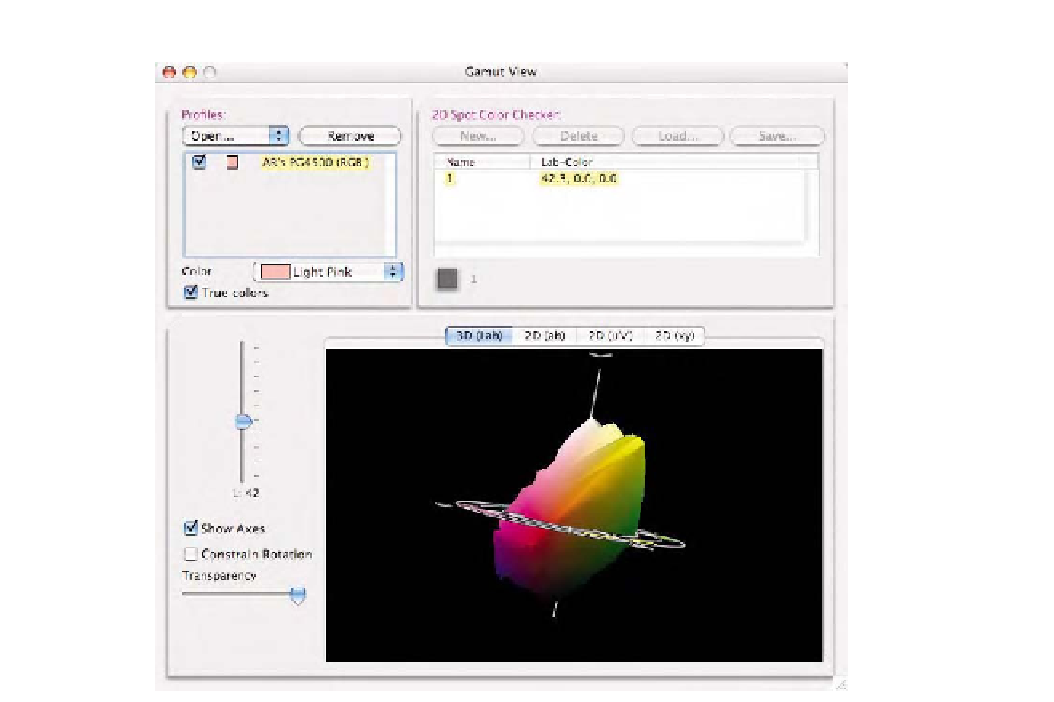
Fig. 6-35
The profile
gamut viewer in
ProfileEditor shown here
plotting a 3D graph of an
output profile of my Fuji
Pictrography 4500. When a
2D plot is shown, users
can measure and load spot
measurements using a
Spectrophotometer and
see how it plots onto the
gamut map of the selected
profile.
should be edited as seen earlier in Fig. 6-29. Once you choose what part
of a profile to edit, a resizable before-and-after screen with a supplied
reference image is shown. You can open any existing image file for image
evaluation. However, the supplied image is an excellent visual guide for
profile editing.
This profile editor has many necessary tools such as lightness and
saturation, where the saturation can be affected using a curve interface
(see Fig. 6-36). This is a much more powerful way of editing saturation
compared to using a simple slider. You can increase or decrease satura-
tion using a curve interface whereby less saturated colors are plotted
toward the bottom of the curve and higher saturation areas are on top
of the curve. A standard curve dialog allows individual color channels or
the composite of all channels to be edited for tone or color. This product
also allows the editing of the media white point, for affecting the absolute
colorimetric intent used for paper white simulation. An info palette pro-
vides numeric feedback in LCH and LAB, as well as the native color space
of the output profile. Selective color edits are available only for output
profiles that were originally created with a Monaco profiling product.