Biomedical Engineering Reference
In-Depth Information
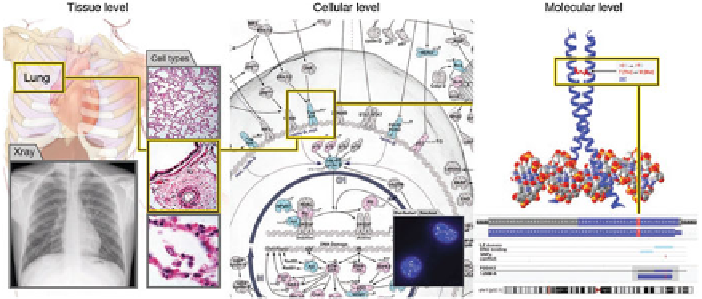
Fig. 5.5
Integrated visualization environment proposed by [
21
] (Reprinted by permission from
Macmillan Publishers Ltd:
Nature Methods,
vol. 7, O'Donoghue, S. I. et al.: Visualizing biological
data—now and in the future, S2-S4, Copyright © 2010 Nature America, Inc. Images courtesy of
ClearScience (drawing), iStockPhoto (lung X-ray), University of Kansas Medical Center, Depart-
ment of Anatomy and Cell Biology (lung histology), Digizyme and Cell Signaling Technology
(pathway). Protein structure and sequence alignment made using SRS 3D [
43
]. Chromosome image
fromUCSCGenome Browser [
44
],
Nucleic Acids Res.
, vol. 38, Rhead, B. et al.: The UCSCGenome
Browser database: update 2010, D613-D619, 2010, by permission of Oxford University Press
are analyzed in strongly separated scales. This fact is considered the “tyranny of
the scales” [
8
]. The observation and quantification of natural processes occurring at
multiple scales is not possible without a multi-scalar framework, resulting from a
multi-disciplinary conception among scientists and visualization researchers [
42
].
The main challenge for multiscale visualization of biomedical data is:
how to
display simultaneously multiple visual features that map to very different space-
time regions?
[
27
]. Detailed and global content information are usually distributed
at different scale levels, and also small scales should have visibility in large scales
(Fig.
5.5
).
Requests for biomedical multiscale modeling and visualization have been made
during the last decade. Additionally, the level of integration of multi-disciplinary
and multiscale research has been increasing in the last years, as discussed later in
this section. However, according to Gehlenborg, “Truly integrated visualization of
systems biology data across the entire range of possible data types is still very much
in its infancy” [
45
].
Lorensen [
20
] emphasized the need to form alliances with the fields of application
of visualization. An understanding of each scale is required, but the importance lies
in coupling scales in a multiscale user interface. This interplay will provide a more
complete meaningful analysis and lead to solutions that will provide scientists with
new knowledge that would have not been understood without a proper multiscale
visualization.