Graphics Reference
In-Depth Information
Now let's turn our attention to the highlights, which are controlled by
the top-right point on the graph. Here's where that camera focus analogy
comes into play. We can see that the highlights are already clipped, so we
don't really need to try to drag the white point to the left along the top.
That would just cause the clipping to worsen. But we can try to focus the
adjustment down a little to see if we can undo some of the clipping. Pull-
ing the white point down a little (
Figure 2.27
) basically just lowers the
overall level and doesn't unclip the whites. But the original level was at
110IRE, so I brought my white level down to 231 to bring the image into
legal range. (This is just legal for luminance. Chroma information could
still be illegal.)
To set the midtones of the image—similar to what you did with the
gamma adjustment in Color—click on a point about halfway up the diag-
onal line. Pick a spot at about 160 input, 120 output (looking at the small
numbers below the master curve). The values of this point actually tell
you a little about the mathematics of how the signal is being remapped
as you make your corrections. If you hadn't moved the highlights or
shadows, all of the points along the diagonal line should match perfectly.
The input number and the output number should be identical. But you
remapped the shadow values to have a big difference in value (60 input,
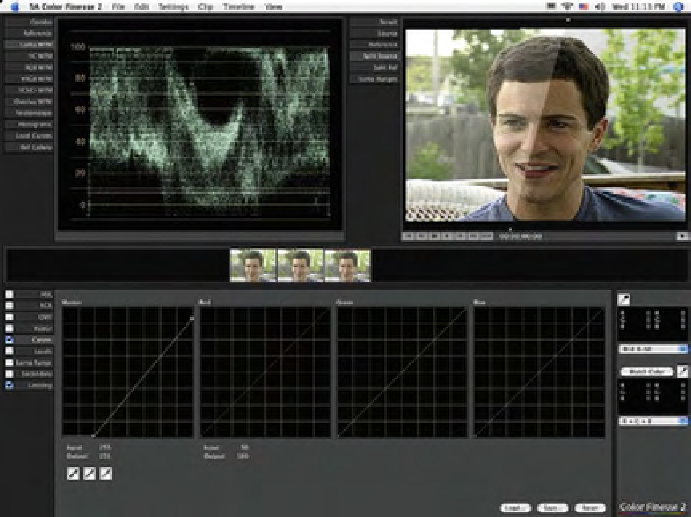
0 output); the highlights had a small drop (255 to 231) and the middle of
Fig. 2.27
Note the split screen showing the source and the correction.
Search WWH ::

Custom Search