Graphics Reference
In-Depth Information
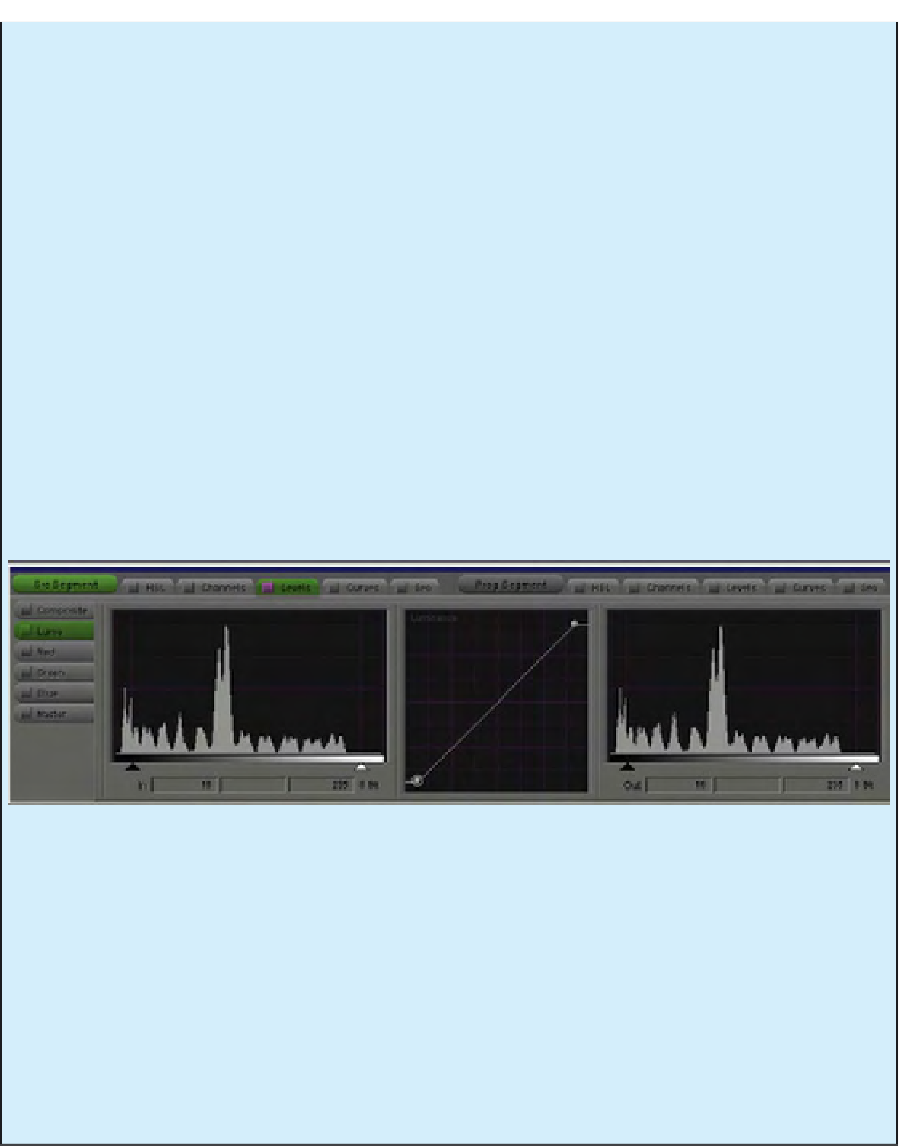
Here is the final position of the Levels (
Figure 2.18
), including a midtone correction to lift the face out of the shadows.
I wouldn't call this a final correction, but that's as far as we'll take it in Levels. Notice that there is a small spike to the left
of the output histogram. I chose to let some of the blacks lose detail, but not a lot. I assume that most of those pixels are
in the black leg at the bottom of the frame and possibly in my (yes, that's me—or it was, back in about 2005) black hair.
Another way to gain an understanding of histograms is to look at the grayscale chart (
Figure 2.19
)
as a histo-
gram (
Figure 2.20
). There is a video version of this file called “grayscale_neutral” on the DVD.
Fig. 2.19
Fig. 2.20
If you look at the Luma tab, you can see the five small double spikes to the right of the big middle spike and the
five small double spikes to the left of the middle spike. These five left spikes are the five darker chips. The five spikes
to the right are the five brighter chips. The big middle spike is the middle gray chip plus the surrounding gray back-
ground. That's why the middle spike is so much bigger. In this case, the spike does not indicate clipping but simply a
large area that is supposed to have the same color to it. Remember that the vertical axis of the graph doesn't indicate
brightness, but the number of pixels at a given brightness level. So, because there is a greater area of middle gray on
the chart, the histogram shows many more pixels at this middle tonal range. Having spikes that do not indicate clip-
ping is very rare in most “natural” video images. Usually, there is some kind of gradation or imperfection to the color.
There is also a larger bump to the far left side, indicating the larger patches of black on the sides and in the
middle of the chart and possibly even some of the black text on the chart.

Search WWH ::

Custom Search