Graphics Reference
In-Depth Information
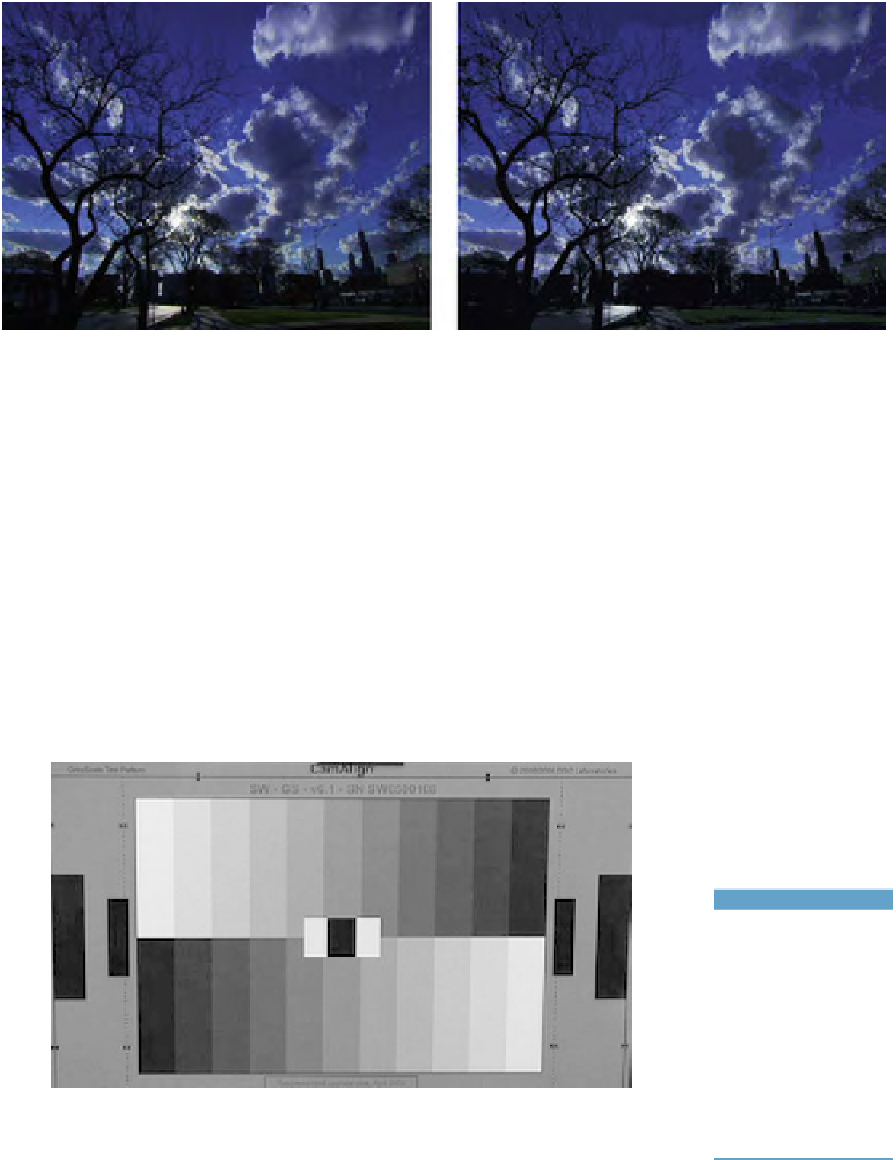
(a)
(b)
Fig. 2.3
(a) Original image, DV resolution (Courtesy Randy Riesen). (b) Sky exhibiting banding.
banding:
Similar to
posterization, banding
occurs when a continuous
tone image breaks down
into bands of distinct,
individual tones. This effect
usually occurs in gradients
such as the sky. For
example, the image begins
as a continuous gradation
from light blue to dark blue,
then through overcorrection
(or a radical change in color
space or compression) turns
into individually discernable
bands of color (
Figure 2.3
b
).
Banding is more likely to
happen with lower-bit-
depth images (8-bit instead
of 10-bit images).
Sliders and Numerical Controls for Tonal Range
Let's start the exploration of these tonal correction tools with simple
sliders and numerical input. There are two test patterns that can help
you understand the specifics of what these tools can do as you start to
explore.
Load the chip chart image from the DVD tutorial media folder (“gray-
scale_neutral”) and load a ramp pattern. See if your application has one
of these ramps. It will have been created for the specific way that your
application treats video black. If not, you can use one of the ramps on the
DVD (“ramp from 0-254.psd”).
D e f i n i t i o n
chip chart:
A camera
setup chart that has several
different gray “chips” that
range from white to black.
The chart that is used
throughout this topic is DSC
Labs CamAlign GrayScale
Test Pattern chart (
Figure
2.4
). It has 11 gray patches
or “chips” that have spe-
cific reflectance values.
Fig. 2.4
DSC CamAlign GreyScale Test Pattern, courtesy DSC Labs, Toronto.

Search WWH ::

Custom Search