Graphics Reference
In-Depth Information
Fig. 12.9
Fig. 12.10
Fig. 12.11
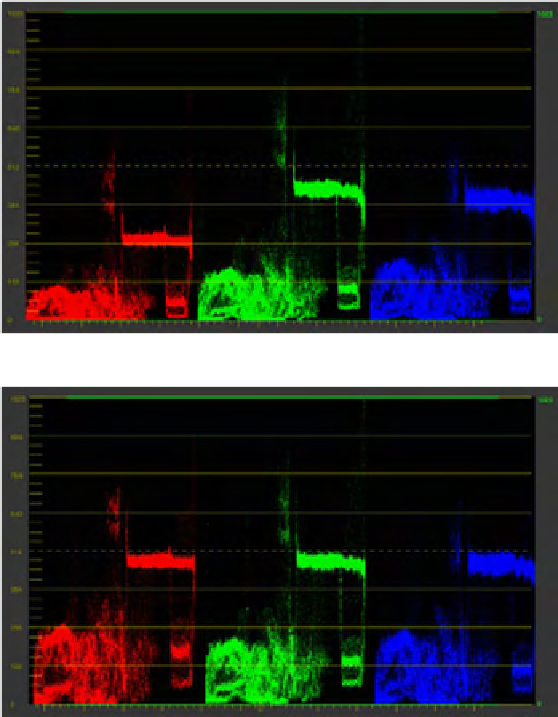
Internal RGB
Parade shows that the red
channel is weak and the
blue and green channels
are stronger, indicating a
cyan cast in the midtones.
Fig. 12.12
The internal
RGB Parade after the Cus-
tom Curve correction.


Search WWH ::

Custom Search