Graphics Programs Reference
In-Depth Information
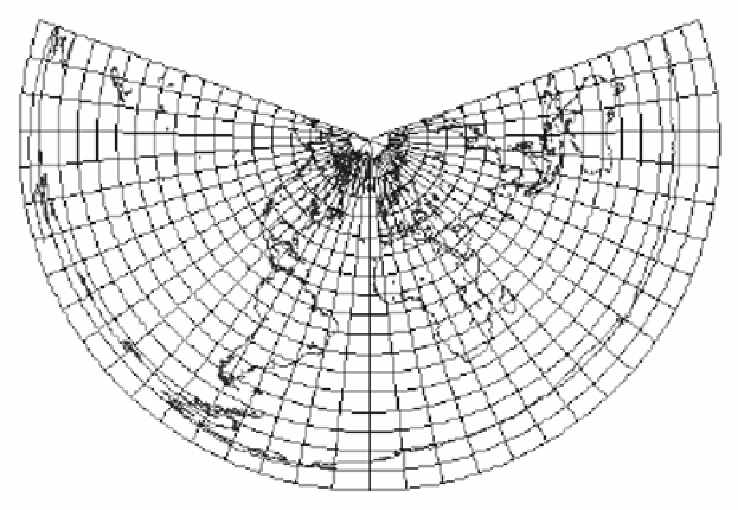
Figure 4.60: A Conical Projection.
Lambert's conic conformal projection
. This type of projection was developed by
Johann Lambert in 1772. After staying dormant for many years, it was revived dur-
ing World War I and became the standard projection for intermediate and large-scale
maps of regions in midlatitudes. Recall that “conformal” means shape preserving. A
conformal mapping also preserves all angles between intersecting lines or curves. The
principle of this projection is illustrated in Figure 4.61a. A cone is placed at a secant
to the globe, intersecting the globe in two circles that become standard parallels. The
distance between those parallels, which we denote by
d
, becomes 4
/
6 of the vertical di-
mension of the projection. Thus, the projection covers a distance of 6
d/
4inthevertical
direction. The projection extends
d/
4aboveand
d/
4 below the standard parallels. The
top and bottom of the cone are trimmed, and it is unrolled and takes a shape similar to
that featured in Figure 4.61b. Notice the right angles between the (straight) meridians
and the (curved) parallels. The scale along the two standard parallels is exact: The
scale between them is less than 1 but its smallest value is only 0.99. The scale above
and below them is greater than 1 but does not exceed 1.01.
Albers's conic equal-area projection
. This projection, developed by Heinrich Albers
in 1805, is very similar to Lambert's conical conformal projection. The cone is at a
secant to the globe and intersects it at two latitudes. The difference between these two
projections is that Albers shifts the parallels on the cone in order to preserve areas in a
way similar to the cylindrical equal-area projection.
Given a point
P
on the globe, its projection
P
∗
is determined by constructing a
straight segment from
P
that is normal to the cone.
Search WWH ::

Custom Search