Graphics Programs Reference
In-Depth Information
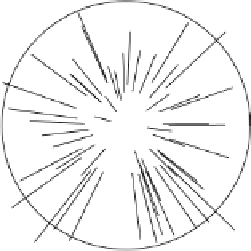
Figure 4.3 illustrates this process with 50 points. It is easy to see how the distance of
a point from the center of the circle affects the amount by which it is moved toward
the center. (The code that generated this figure is kept simple. It generates 50 points
with random coordinates in the interval [
−
10
,
10], which is why some points are located
outside the radius-10 circle.)
Figure 4.3: Moving Points in Hemispherical Fisheye Projection.
(* hemispherical fisheye projection *)
Clear[k, n, P, Q, L]
k=10; n=50;
scal[q_]:=(k Tan[ArcTan[q/k]/2])/q;
P=Table[{Random[Real,{-10.,10.}], Random[Real,{-10., 10.}]},{n}];
Q=Table[Sqrt[P[[i]].P[[i]]], {i, n}];
L=Table[Line[{P[[i]], scal[Q[[i]]] P[[i]]}], {i, n}];
Show[Graphics[L], Graphics[Circle[{0, 0}, 10]],
Graphics[Point[{0, 0}]],
AspectRatio -> 1]
Code for Figure 4.3
It is possible to extend this variant of the fisheye projection to cover more than
180
◦
of space. Figure 4.4a shows how a coverage of up to about 220
◦
can be achieved
by bending the
xy
plane “backward” (i.e., toward the negative
z
axis) and projecting
all the three-dimensional points that are located to the “right” of this bent plane. Once
this is done, the points are scaled as before into the radius-
k
circle.
Figure 4.4b is an example of the type of distortion typical of the hemispherical
fisheye projection. The figure shows the old executive o
ce building in Washington,
D.C., and it is easy to see that both the vertical lines (the tree in the foreground) and
horizontal lines (the fence) are curved and that image elements in the center are more
detailed than those near the periphery.
Exercise 4.2:
Explain why we expect vertical and horizontal straight lines to become
curved in a fisheye projection.
Well-known examples of the hemispherical fisheye projection are
Hand with Re-
flecting Sphere
and
Circle Limit IV (Heaven and Hell)
by M. C. Escher [Ernst 76].
Search WWH ::

Custom Search