Database Reference
In-Depth Information
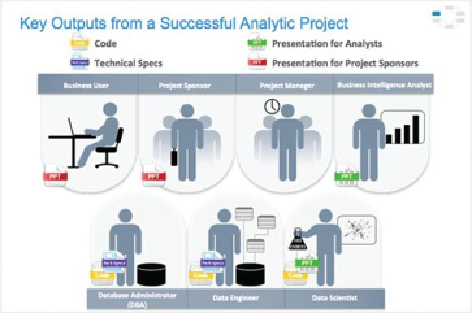
Figure 2.9
Key outputs from a successful analytics project
Although these seven roles represent many interests within a project, these
interests usually overlap, and most of them can be met with four main deliverables.
• Presentation for project sponsors: This contains high-level takeaways for
executive level stakeholders, with a few key messages to aid their
decision-making process. Focus on clean, easy visuals for the presenter to
explain and for the viewer to grasp.
• Presentation for analysts, which describes business process changes and
reporting changes. Fellow data scientists will want the details and are
comfortable with technical graphs (such as Receiver Operating
Characteristic [ROC] curves, density plots, and histograms shown in
Chapter 3 and Chapter 7).
• Code for technical people.
• Technical specifications of implementing the code.
As a general rule, the more executive the audience, the more succinct the
presentation needs to be. Most executive sponsors attend many briefings in the
course of a day or a week. Ensure that the presentation gets to the point quickly and
frames the results in terms of value to the sponsor's organization. For instance, if
the team is working with a bank to analyze cases of credit card fraud, highlight the
frequency of fraud, the number of cases in the past month or year, and the cost or
revenue impact to the bank (or focus on the reverse—how much more revenue the
bank could gain if it addresses the fraud problem). This demonstrates the business
impact better than deep dives on the methodology. The presentation needs to