Database Reference
In-Depth Information
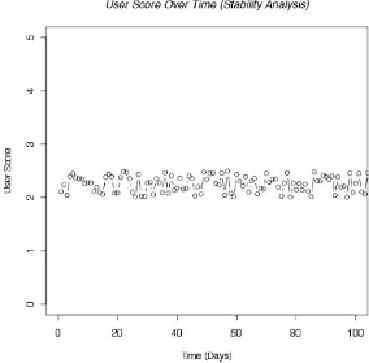
Figure 12.22
Graph of stability analysis for pricing
By this point the data scientist has learned the following about this example and
made several observations about the data:
• Most user scores are between two and three in terms of their price
sensitivity.
• After taking the log value of the user scores, a new user scoring index was
created, which recentered the data values around the center of the
distribution.
• The pricing scores appear to be stable over time, as the duration of the
customer does not seem to have significant influence on the user pricing
score. Instead, it appears to be relatively constant over time, within a
small band of user scores.
At this point, the analysts may want to explore the range of price tiers offered
to customers.
Figures 12.22
and
12.23
demonstrate examples of the price tiering
currently in place within the customer base.