Database Reference
In-Depth Information
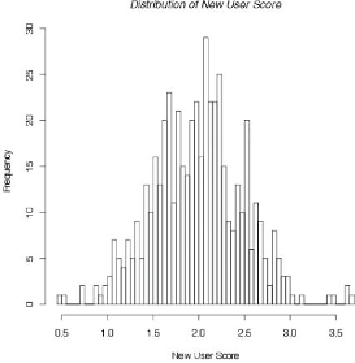
Figure 12.21
Frequency distribution of new user scores
Another idea may be to analyze the stability of price distributions over time to see
if the prices offered to customers are stable or volatile. As shown in a graphic such
as
Figure 12.22
,
the prices appear to be stable. In this example, the user score of
pricing remains within a tight band between two and three regardless of the time
in days. In other words, the time in which a customer purchases a given product
does not significantly influence the price she is willing to pay, as expressed by the
user score, shown on the y-axis.