Database Reference
In-Depth Information
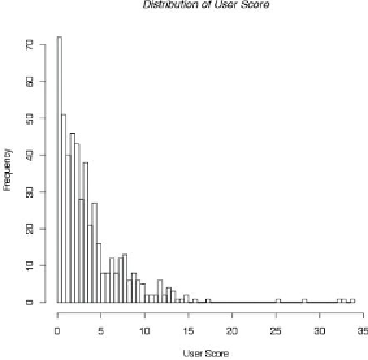
Figure 12.19
Frequency distribution of user scores
A data scientist's first step may be to view the data as a raw distribution of the
pricing levels of users. Because the values have a long tail to the right, in
Figure
user scores of zero and five.
To understand this better, a data scientist may rerun this distribution showing a
log distribution (Chapter 3) of the user score, as demonstrated in
Figure 12.20
.