Database Reference
In-Depth Information
WHERE year = 2014
AND week <= 26
ORDER BY year,
week
year week sales ewma
2014 1 1564539 1564539.00
2014 2 1572128 1565297.90
2014 3 1582331 1567001.21
2014 4 1600769 1570377.99
2014 5 1580146 1571354.79
.
.
.
2014 23 1519559 1542043.47
2014 24 1559443 1543783.42
2014 25 1525437 1541948.78
2014 26 1556924 1543446.30
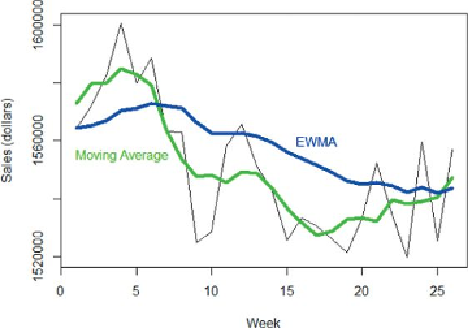
Figure 11.4
includes the EWMA smoothed series to the plot from
Figure 11.3
.
Figure 11.4
Weekly sales with moving average and EWMA
Increasing the value of the smoothing factor from 0.1 causes the EWMA to follow
the actual data better, but the trade-off is that large fluctuations in the data cause
larger fluctuations in the smoothed series. The user-defined aggregate,
ewma()
, is