Database Reference
In-Depth Information
Figure 8.19 Plot of residuals from the fitted (0,1,1) × (1,0,0) 12 model
Figure 8.20 Histogram of the residuals from the fitted (0,1,1) × (1,0,0) 12 model
Figure 8.21 Q-Q plot of the residuals from the fitted (0,1,1) (1,0,0) 12 model
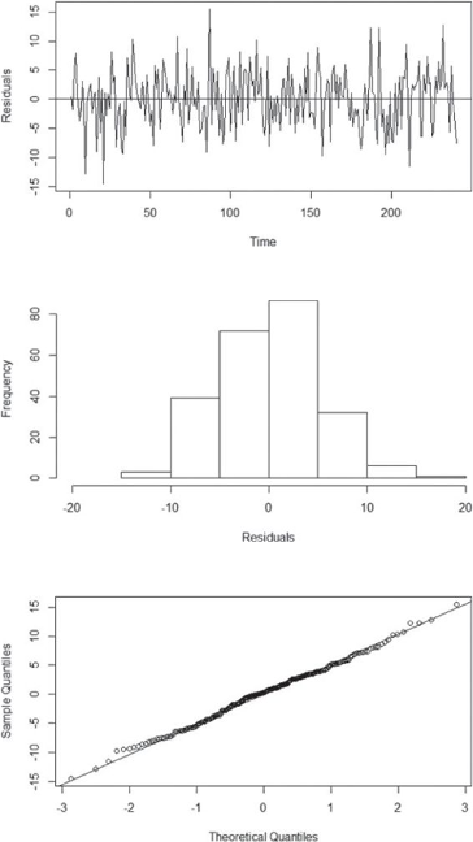
If the normality or the constant variance assumptions do not appear to be true, it
may be necessary to transform the time series prior to fitting the ARIMA model. A
common transformation is to apply a logarithm function.
Search WWH ::


Custom Search