Database Reference
In-Depth Information
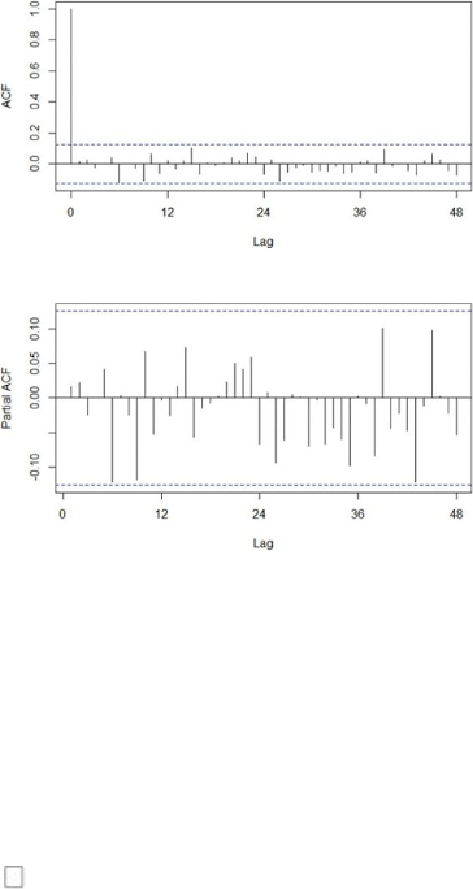
It should be noted that the ACF and PACF plots each have several points that
are close to the bounds at a 95% significance level. However, these points occur
at relatively large lags. To avoid overfitting the model, these values are attributed
to random chance. So no attempt is made to include these lags in the model.
However, it is advisable to compare a reasonably fitting model to slight variations
of that model.
Comparing Fitted Time Series Models
The
arima()
function in R uses Maximum Likelihood Estimation (MLE) to
estimate the model coefficients. In the R output for an ARIMA model, the
log-likelihood ( ) value is provided. The values of the model coefficients are
determined such that the value of the log likelihood function is maximized. Based
on the
value, the R output provides several measures that are useful for