Database Reference
In-Depth Information
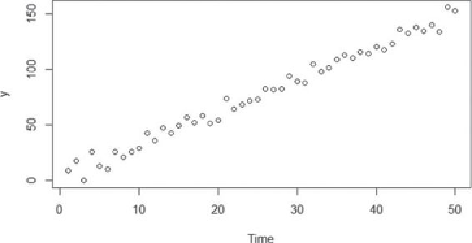
Figure 8.7
A time series with a trend
If detrending using a linear or higher order regression model does not provide a
stationary series, a second option is to compute the difference between successive
y-values. This is known as
differencing
. In other words, for the n values in a
given time series compute the differences as shown in
Equation 8.16
.
The mean of the time series plotted in
Figure 8.8
is certainly not a constant.
Applying differencing to the time series results in the plot in
Figure 8.9
.
This plot
illustrates a time series with a constant mean and a fairly constant variance over
time.