Database Reference
In-Depth Information
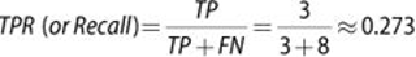
These metrics show that for the bank marketing example, the naïve Bayes classifier
performs well with accuracy and FPR measures and relatively well on precision.
However, it performs poorly on TPR and FNR. To improve the performance, try
to include more attributes in the datasets to better distinguish the characteristics
of the records. There are other ways to evaluate the performance of a classifier in
general, such as
N
-fold cross validation (Chapter 6) or bootstrap [14].
Chapter 6 has introduced the
ROC curve,
which is a common tool to evaluate
classifiers. The abbreviation stands for
receiver operating characteristic
, a
term used in signal detection to characterize the trade-off between hit rate and
false-alarm rate over a noisy channel. A ROC curve evaluates the performance
of a classifier based on the TP and FP, regardless of other factors such as class
distribution and error costs. The vertical axis is the True Positive Rate (TPR), and
the horizontal axis is the False Positive Rate (FPR).
As seen in Chapter 6, any classifier can achieve the bottom left of the graph where
TPR = FPR = 0 by classifying everything as negative. Similarly, any classifier can
achieve the top right of the graph where TPR = FPR = 1 by classifying everything
as positive. If a classifier performs “at chance” by random guessing the results, it
can achieve any point on the diagonal line TPR=FPR by choosing an appropriate
threshold of positive/negative. An ideal classifier should perfectly separate
positives from negatives and thus achieve the top-left corner (TPR = 1, FPR = 0).
The ROC curve of such classifiers goes straight up from TPR = FPR = 0 to the
top-left corner and moves straight right to the top-right corner. In reality, it can be