Database Reference
In-Depth Information
example and provides the line that the points should follow for values from a
normal distribution.
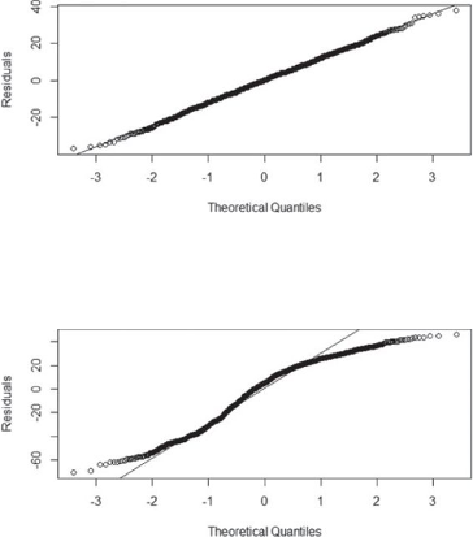
qqnorm(results2$residuals, ylab="Residuals", main="")
qqline(results2$residuals)
Figure 6.12
Q-Q plot of normally distributed residuals
A Q-Q plot as provided in
Figure 6.13
would indicate that additional refinement of
the model is required to achieve normally distributed error terms.
Figure 6.13
Q-Q plot of non-normally distributed residuals
N-Fold Cross-Validation
To prevent overfitting a given dataset, a common practice is to randomly split the
entire dataset into a training set and a testing set. Once the model is developed
on the training set, the model is evaluated against the testing set. When there
is not enough data to create training and testing sets, an N-fold cross-validation
technique may be helpful to compare one fitted model against another. In N-fold
cross-validation, the following occurs: