Database Reference
In-Depth Information
axis.line.tck = 0,
axis.text.alpha = 0)
Figure 6.4
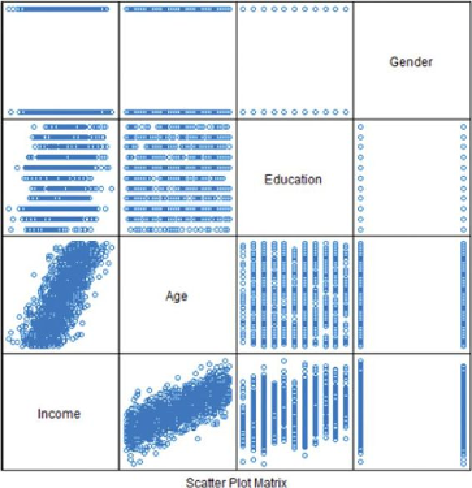
Scatterplot matrix of the variables
Because the dependent variable is typically plotted along the y-axis, examine the
set of scatterplots along the bottom of the matrix. A strong positive linear trend is
observed for
Income
as a function of
Age
. Against
Education
, a slight positive
trend may exist, but the trend is not quite as obvious as is the case with the
Age
variable. Lastly, there is no observed effect on
Income
based on
Gender
.
With this qualitative understanding of the relationships between
Income
and
the input variables, it seems reasonable to quantitatively evaluate the linear
relationships of these variables. Utilizing the normality assumption applied to the
error term, the proposed linear regression model is shown in
Equation 6.5
.
Using the linear model function,
lm()
, in R, the income model can be applied to
the data as follows: