Database Reference
In-Depth Information
As seen in Section 3.3.2, “Difference of Means,” each population is assumed to be
normally distributed with the same variance.
The first thing to calculate for the ANOVA is the test statistic. Essentially, the goal
is to test whether the clusters formed by each population are more tightly grouped
than the spread across all the populations.
Let the total number of populations be . The total number of samples is
randomly split into the groups. The number of samples in the -th group is
denoted as , and the mean of the group is
where
. The mean of all the
samples is denoted as
.
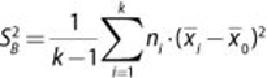
The
between-groups mean sum of squares
,
, is an estimate of the
between-groups variance
. It measures how the population means vary with
respect to the grand mean, or the mean spread across all the populations. Formally,
this is presented as shown in
Equation 3.4
.
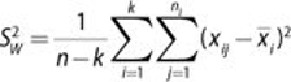
The
within-group mean sum of squares
,
, is an estimate of the
within-group variance
. It quantifies the spread of values within groups.
Formally, this is presented as shown in
Equation 3.5
.
3.5
If
is much larger than
, then some of the population means are different from
each other.
The
F
-test statistic is defined as the ratio of the between-groups mean sum of
squares and the within-group mean sum of squares. Formally, this is presented as
shown in
Equation 3.6
.