Database Reference
In-Depth Information
and
t
are the observed values of the
t
-statistic. In the R output,
. The
left shaded area corresponds to the
, and the right shaded area
corresponds to the
.
Figure 3.24
Area under the tails (shaded) of a student's t-distribution
In the R output, for a significance level of 0.05, the null hypothesis would not
be rejected because the likelihood of a
T
value of magnitude 1.7828 or greater
would occur at higher probability than 0.05. However, based on the
p
-value, if
the significance level was chosen to be 0.10, instead of 0.05, the null hypothesis
would be rejected. In general, the
p
-value offers the probability of observing such a
sample result given the null hypothesis is
TRUE
.
A key assumption in using Student's
t
-test is that the population variances are
equal. In the previous example, the
t.test()
function call includes
var.equal=TRUE
to specify that equality of the variances should be assumed. If
that assumption is not appropriate, then Welch's
t
-test should be used.
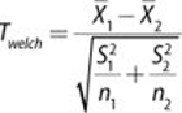
Welch's t-test
When the equal population variance assumption is not justified in performing
Student's
t
-test for the difference of means, Welch's
t
-test [14] can be used based
on
T
expressed in
Equation 3.2
.
where , , and correspond to the
i
-th sample mean, sample variance, and
sample size. Notice that Welch's
t
-test uses the sample variance ( ) for each
population instead of the pooled sample variance.
In Welch's test, under the remaining assumptions of random samples from two
normal populations with the same mean, the distribution of
T
is approximated by