Database Reference
In-Depth Information
and are better suited to technical audiences such as data scientists. Nontechnical
stakeholders, however, generally prefer simple, clear graphics that focus on the
message rather than the data.
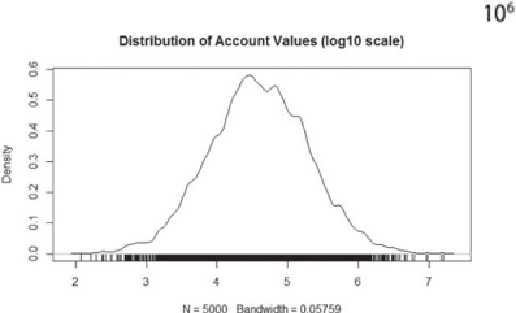
Figure 3.20
shows the density plot on the distribution of account values from a
bank. The data has been converted to the log
10
scale. The plot includes a rug on
the bottom to show the distribution of the variable. This graph is more suitable
for data scientists and business analysts because it provides information that can
be relevant to the downstream analysis. The graph shows that the transformed
account values follow an approximate normal distribution, in the range from $100
to $10,000,000. The median account value is approximately $30,000 (
), with
the majority of the accounts between $1,000 (
) and $1,000,000 (
).
Figure 3.20
Density plots are better to show to data scientists
Density plots are fairly technical, and they contain so much information that they
would be difficult to explain to less technical stakeholders. For example, it would
be challenging to explain why the account values are in the log
10
scale, and such
information is not relevant to stakeholders. The same message can be conveyed
by partitioning the data into log-like bins and presenting it as a histogram. As
can be seen in
Figure 3.21
,
the bulk of the accounts are in the $1,000-1,000,000
range, with the peak concentration in the $10-50K range, extending to $500K.
This portrayal gives the stakeholders a better sense of the customer base than the
density plot shown in
Figure 3.20
.