Database Reference
In-Depth Information
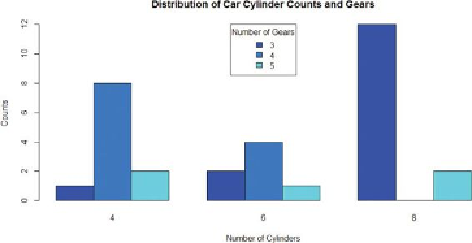
Figure 3.15
Barplot to visualize multiple variables
Box-and-Whisker Plot
Box-and-whisker plots show the distribution of a continuous variable for each
value of a discrete variable. The box-and-whisker plot in
Figure 3.16
visualizes
mean household incomes as a function of region in the United States. The first
digit of the U.S. postal (“ZIP”) code corresponds to a geographical region in the
United States. In
Figure 3.16
, each data point corresponds to the mean household
income from a particular zip code. The horizontal axis represents the first digit of
a zip code, ranging from 0 to 9, where 0 corresponds to the northeast region of the
United States (such as Maine, Vermont, and Massachusetts), and 9 corresponds to
the southwest region (such as California and Hawaii). The vertical axis represents
the logarithm of mean household incomes. The logarithm is taken to better
visualize the distribution of the mean household incomes.