Database Reference
In-Depth Information
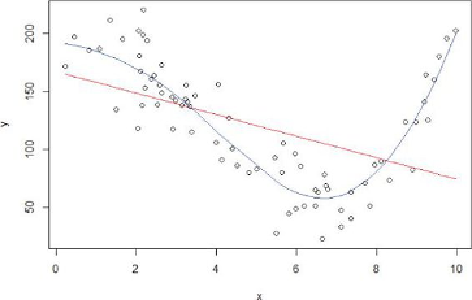
Figure 3.13
Examining two variables with regression
75 numbers between 0 to 10 with random deviates, and the numbers conform
to the uniform distribution. The
rnorm(75,0,20)
generates 75 numbers that
conform to the normal distribution, with the mean equal to 0 and the standard
deviation equal to 20. The
points()
function is a generic function that draws
a sequence of points at the specified coordinates. Parameter
type="l"
tells the
function to draw a solid line. The
col
parameter sets the color of the line, where 2
represents the red color and 4 represents the blue color.
# 75 numbers between 0 and 10 of uniform distribution
x <- runif(75, 0, 10)
x <- sort(x)
y <- 200 + x^3 - 10 * x^2 + x + rnorm(75, 0, 20)
lr <- lm(y ˜ x)
# linear regression
poly <- loess(y ˜ x)
# LOESS
fit <- predict(poly)
# fit a nonlinear line
plot(x,y)
# draw the fitted line for the linear regression
points(x, lr$coefficients[1] + lr$coefficients[2] * x,
type = "l", col = 2)
# draw the fitted line with LOESS
points(x, fit, type = "l", col = 4)