Database Reference
In-Depth Information
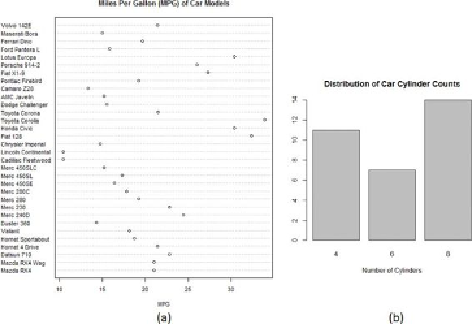
Figure 3.10
(a) Dotchart on the miles per gallon of cars and (b) Barplot on the
distribution of car cylinder counts
The plots in
Figure 3.10
can be produced with the following R code.
data(mtcars)
dotchart(mtcars$mpg,labels=row.names(mtcars),cex=.7,
main="Miles Per Gallon (MPG) of Car Models",
xlab="MPG")
barplot(table(mtcars$cyl), main="Distribution of Car
Cylinder Counts",
xlab="Number of Cylinders")
Histogram and Density Plot
Figure 3.11
(
a) includes a histogram of household income. The histogram shows a
clear concentration of low household incomes on the left and the long tail of the
higher incomes on the right.