Database Reference
In-Depth Information
on the textual descriptions of the Innovation Roadmap ideas. In addition, he
conducted social network analysis using R and RStudio, and then he developed
social graphs and visualizations of the network of communications related to
innovation using R's
ggplot2
package. Examples of this work are shown in
Figures 2.10
and
2.11
.
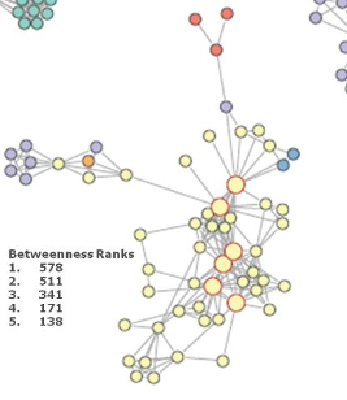
Figure 2.10
Social graph [27] visualization of idea submitters and finalists
Figure 2.11
Social graph visualization of top innovation influencers
Figure 2.10
shows social graphs that portray the relationships between idea
submitters within GINA. Each color represents an innovator from a different