Geoscience Reference
In-Depth Information
-1
new heterogeneities
introduced
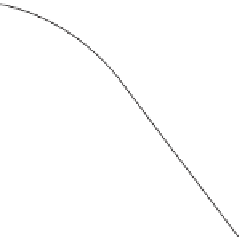
log heterogeneity thickness
Figure 6.9
Mixing and stirring. Large-scale heterogeneities (e.g. lithospheric plates) introduced into the
mantle are stretched and folded by convection: more abundant and thinner stripes replace the
thick original ones. This is the stirring domain and transport is, at least in theory, still reversible.
The slope of the log-log plot is
1. When the stripes are reduced so that diffusion becomes a
significant transport process, transport becomes irreversible and may be called mixing.
−
baking bread. Each event doubles the number of layers and reduces its thickness by a
factor of two. Let us now think of not one but many lithospheric plates or water cores
continuously produced over geological history and injected into the system: each event
of stretching and folding removes a layer from its “class of thickness” and adds it to the
class of half of the original value. We can again apply our birth-and-death theory to guess
the fate of heterogeneities: created by continuous addition of large new objects (young
plates), their characteristic sizes trickle down the length scale upon the effect of mantle
when the thickness of the stretched and folded layers is reduced to very small length scales
(typically 1-10 cm in the mantle), diffusion transport becomes the prevalent smoothing
process. Small-scale heterogeneities disappear over time scales of 100-1000 Ma in the
mantle and of 10-100 years in the ocean.
Because they are continuously recreated, heterogeneities are unlikely to be evenly dis-
tributed, whether stirring by convection is vigorous or not. The most probable outcome
in a randomly mixed medium is not a pattern of chemical homogeneity. Let us illustrate
this point through a naive comparison. A handful of rice thrown on a checkered table will
never produce a regular distribution of grains over the surface. Instead, the grains will
appear “randomly” spread (
Fig. 6.10
). By randomly, we mean that any small square is as
likely to receive a rice grain as another. The number of grains one counts on any patch
delimited on the table would be found nearly proportional to the surface area of the patch.