Agriculture Reference
In-Depth Information
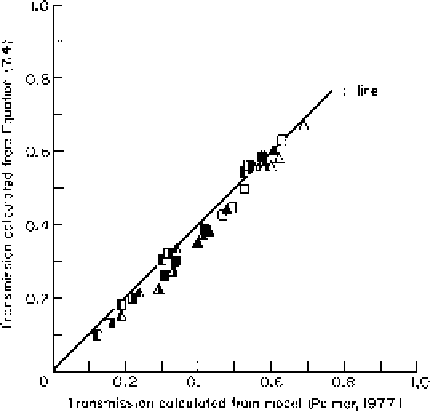
Figure 7.8
Comparison of calculated daily transmission from the
Palmer (1977b) computer model with 50% direct and 50% diffuse
light to that estimated from Equation (7.4) with
K
=
0.6. Comparisons
for the range of hedgerow orchards as shown:
Triangular cross-section
Rectangular cross-section
Hedge height (m)
1
3
1
3
Row spacing (m)
4
4
2
2
For LAIs of 1,2,3,4.
All hedges of 1.5 m spread at ground level.
From Jackson and Palmer (1977). Reproduced with permission.
). This latter method copes with natural patterns of direct and diffuse
irradiation which may differ from 'normal'.
Results obtained by the use of equation
.
agree closely with those cal-
culated from more complexmodels (Figure
). This approach can also be
extended to calculate the leaf area,
L
I
, which will be in receipt of irradiance
at above any given light intensity,
I
L
expressed as a decimal fraction of above
canopy irradiance ( Jackson and Palmer,
.
).
L
I
=
/
−
F
max
[(ln
I
L
)
(
K
)]
(
.
)
or LAI if this is less.
Results obtained by the use of equation
.
agree closely with those calcu-
lated from more complexmodels (Figure
).
F
max
, LAI and
K
are therefore the determinants both of total orchard
canopy light interception and of the leaf area or canopy volume (CV
I
) external
.