Agriculture Reference
In-Depth Information
1
2
3
4
5
6
7
8
9
10
11
12
13
14
15
16
17
18
19
20
21
22
23
24
25
26
27
28
29
30
31
32
33
34
35
36
37
38
39
40
41
42
43
44
45
46
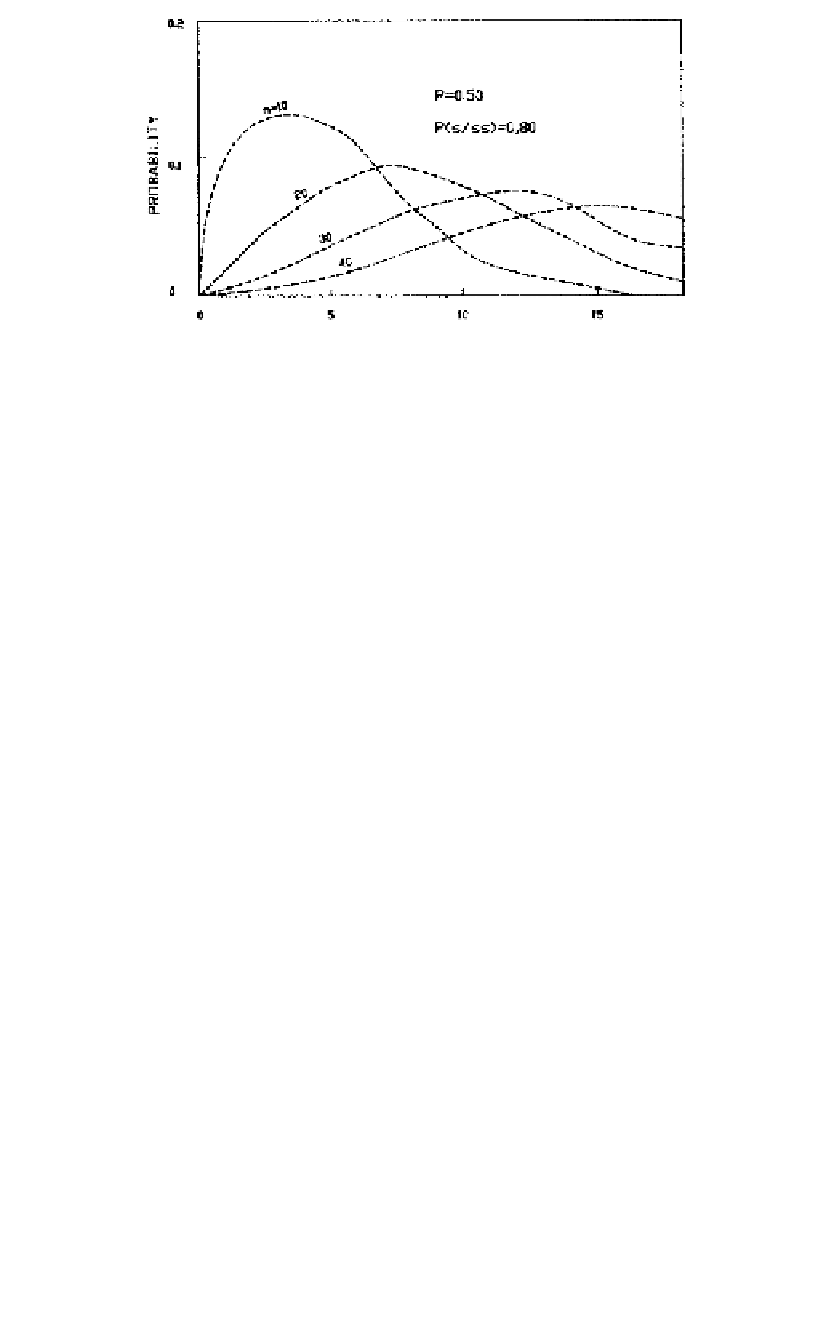
Fig
ure 4.4
Expectation of the critical drought duration for different sample sizes and
P
(+/+
+)
[49],
=
0.8.
Line
——
1.7
——
Norm
PgEn
as
“drought area” and clustering of the wet spell as “wet area.” Here we ex-
pl
ain two different regional drought models. The first model relies on prob-
abilities of dry and wet areas, spell probabilities,
p
r
and
q
r
, respectively.
Because these two events are mutually exclusive,
p
r
+
1. This model
assumes that once a subarea of agricultural land is hit by a dry spell, it re-
mains under this state in the subsequent time instances. Therefore, as time
passes, the number of dry spells hitting the subareas increases steadily un-
til the whole region comes under the influence of drought. Such a regional
model has been referred to as regional persistence model ( ¸ en, 1980b). The
application of this model is convenient for agricultural droughts in arid and
semiarid regions where long drought periods occur.
The second model takes into account the regional as well as the tem-
poral occurrence probabilities of wet and dry spells. The probabilities of
temporal SMS (
p
t
) and SMD (
q
t
) are mutually exclusive, and therefore,
p
t
+
q
r
=
[49],
1. In this model, in an already drought-stricken area, subareas are
subject to temporal drought effects in the next time interval. This model is
also known as multiseasonal model because it can be applied for a duration
that may include several dry and wet periods. Since agriculture is a seasonal
activity, this seasonal model is suitable for agricultural drought modeling.
q
t
=
Regional Drought Modeling
Let an agricultural land be divided into
m
mutually exclusive subareas, each with the same chance of spatial and
temporal drought. The Bernoulli distribution theory can be used to find
the extent of drought area,
A
d
, during a time interval,
t
. The probability
of
n
1
subareas affected by drought can be written according to Bernoulli
distribution as (Feller, 1967)
m
n
1
p
n
1
r
q
m
−
n
1
r
P
t
(
A
d
=
n
1
)
=
p
r
+
q
r
=
1
.
0
[4.16]
This implies that out of
m
possible drought-prone subareas,
n
1
have SMD,


Search WWH ::

Custom Search