Agriculture Reference
In-Depth Information
1
2
3
4
5
6
7
8
9
10
11
12
13
14
15
16
17
18
19
20
21
22
23
24
25
26
27
28
29
30
31
32
33
34
35
36
37
38
39
40
41
42
43
44
45
46
[444
Line
——
9.0
——
Norm
PgEn
[444
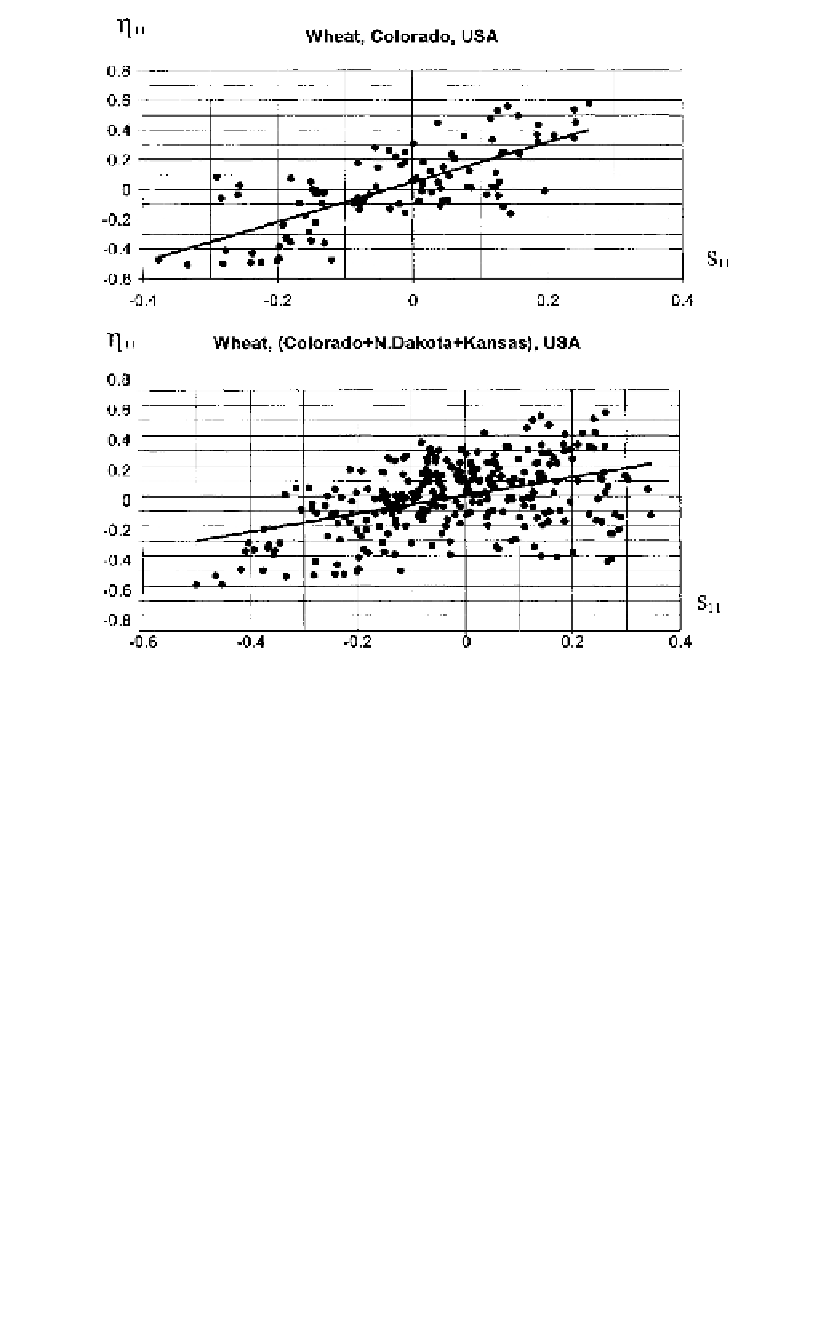
Fig
ure 34.6
Graphs showing relationship between 11-year means of
S
-aridity index S
11
, and
11-year means of wheat yield anomalies.
R
2
=
0.32 (upper graph) and 0.21 (bottom graph).
Data period is from 1891 to 2000.
very large (with A-indicator values varying between 0.20 and 0.40). Spring
wheat cultivation in the former USSR is much larger than winter wheat.
Except for European Russia, spring wheat crops are widely grown in the
south of western Siberia and partly in East Siberia and the Far East. The
A-indicator ranged from 0.20 to 0.60.
Yield variability in Northern America and Canada was studied during
19
34-82. The A-indicator ranged from 0.10 to 0.35, though this range
is
less than in the case of the former USSR agricultural zone. For winter
w
heat, annual variability was more pronounced for the southwestern part
of the U.S. wheat belt. The unsteady character of the rainfall regime dur-
ing the plant-growth season results in significant annual variation in crop
yields. For the grain areas of New Mexico and Colorado, the A-indicator
reached 0.30. The frequent anomalies of wheat yields in these states are
usually caused by droughts and dust storms which also cover the adja-
cent states. Especially large damage to the grain production in these U.S.


Search WWH ::

Custom Search