Agriculture Reference
In-Depth Information
1
2
3
4
5
6
7
8
9
10
11
12
13
14
15
16
17
18
19
20
21
22
23
24
25
26
27
28
29
30
31
32
33
34
35
36
37
38
39
40
41
42
43
44
45
46
[393
Line
——
0.0
——
Norm
PgEn
[393
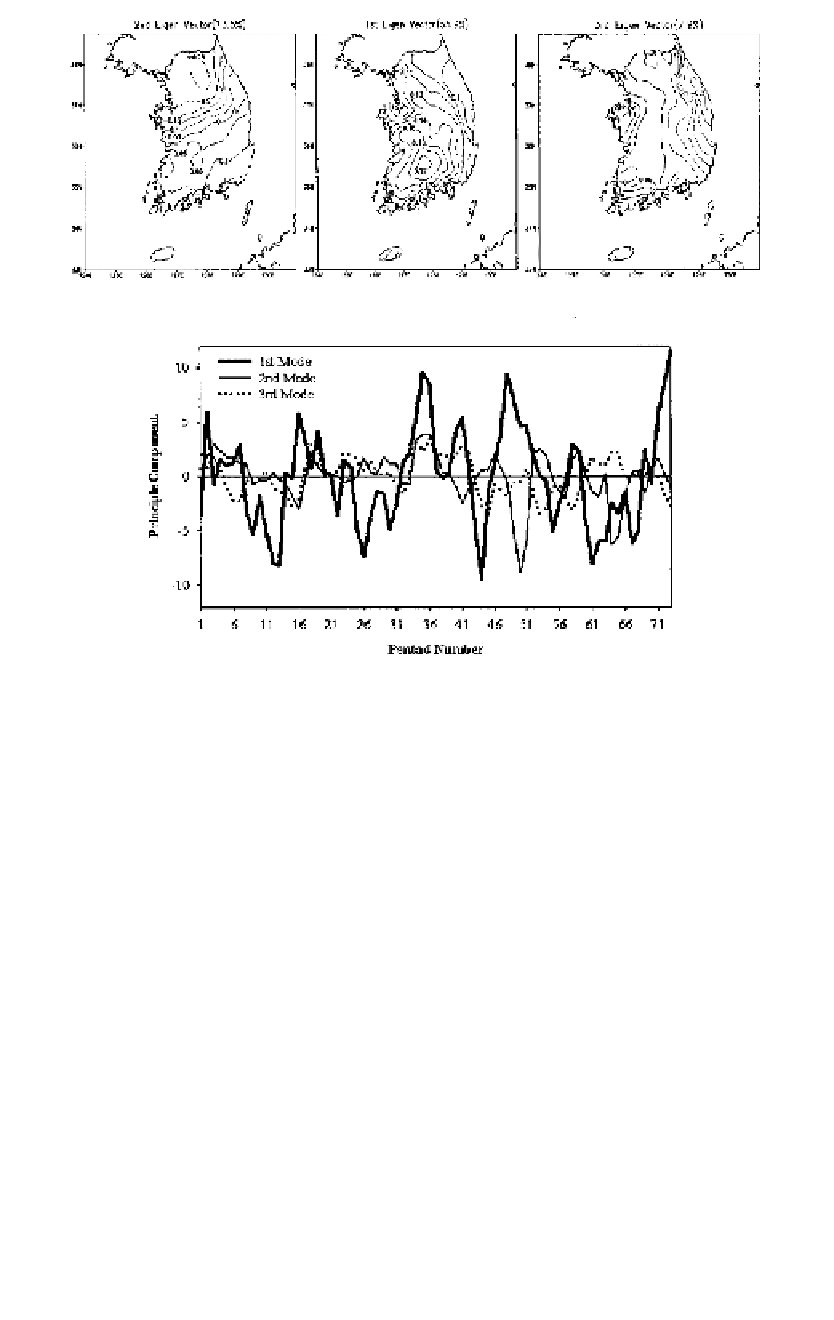
Figure 30.5
Spatial structure of the first (55.9%) and second (13.5%) eigen vectors of 25-
ye
ar mean drought index and the time series of the eigen vectors.
A drought index based on growing degree day (GDD) and soil moisture
can be computed by either the Penman-Monteith equation or the Priestly-
Taylor equation (Priestly and Taylor, 1972) for different soil types.
U
se of Satellite Data
Combining the drought index with the vegetation index derived from satel-
lite data can be a practical approach for agricultural drought monitor-
ing. Normalized difference vegetation index (NDVI) composites with half-
degree spatial resolution over the growing season in Korea (Szilagyi, 2002)
were used to estimate areal evapotranspiration (AET) across Korea using
the biosphere model (SiB2). Soil type, canopy structure, and phenology
were taken into account to estimate the AET.
NDVI maps at a 1.1 km
1.1 km grid interval were derived from
the Advanced Very High Resolution Radiometer (AVHRR) onboard the
U.S. National Oceanic and Atmospheric Administration's (NOAA) polar-
×


Search WWH ::

Custom Search